Note: Descriptions are shown in the official language in which they were submitted.
CA 02980376 2017-09-20
WO 2016/149808 PCT/CA2016/050310
TITLE OF THE INVENTION
METABOLOMICS PROFILING OF CENTRAL NERVOUS SYS __ fE,M INJURY
FIELD OF THE INVENTION
The field of this invention relates to metabolomics and methods of diagnosing
injuries of
the central nervous system (CNS) including all brain spinal cord injuries.
More specifically, the
present invention relates to metabolomics and methods of diagnosing: mild
traumatic brain
injury, including concussion and blast injury; mild spinal cord injury,
including injuries caused
by spine hypefflexion, hyperextension, rotation, lateral stress, compression,
distraction and
spinal cord partial transection; and non-traumatic CNS injuries caused by
strokes, poisonings,
psychological distresses, chemicals, infections, inflammation, autoimmune
diseases,
degenerative processes, hypoxia, ischemia, metabolic derangements and
cancer/radiation.
BACKGROUND OF THE INVENTION
Acquired brain injury (ABI) and Acquired Spinal Cord Injury (ASI) are brain
and spinal
damage, respectively, caused by events that occur in utero, perinatal and post-
natal. These
impairments result from either traumatic brain injury (e.g. mechanical,
pressure-wave, etc.) or
non-traumatic injury derived from either an internal or external source (e.g.
stroke, tumors,
infection, poisoning, hypoxia, ischemia, radiation, substance abuse, etc.).
Traumatic brain injury (TM) is an insult to the brain from an external
mechanical force,
leading to permanent or temporary impairment of cognitive, physical, and
psychosocial
functions, with an associated diminished or altered state of consciousness
(includes both
concussion and blast injury). The Head Injury Interdisciplinary Special
Interest Group of the
American Congress of Rehabilitation Medicine defines "mild" TBI as "a
traumatically induced
physiologic disruption of brain function, as manifested by one of the
following: any period of
loss of consciousness (LOC), any loss of memory for events immediately before
or after the
event, any alteration in mental state at the time of the event and focal
neurologic deficits, which
may or may not be transient. The Glasgow Coma Scale (GCS) helps defines the
severity of a TB!
(3-8, severe; 9-12 moderate; 13-15 mild), based on eye, verbal and motor
responses. TBI is a
major public health concern of epidemic proportions, with an annual incidence
of 1.6 to 3.2
million in the United States. Mild TBI or mrBl, of which concussion and blast
wave injury are
1
CA 02980376 2017-09-20
WO 2016/149808 PCT/CA2016/050310
subsets, is the most common form, representing nearly 75% of all TBIs
[http://www.cdc.gov/TraumaticBrainInjury]. Mild TBI may be caused by impact
forces in which
the head strikes or is struck by something, o impulsive forces, in which the
head moves without
itself being subject to trauma (for example, when the chest hits something and
the head snaps
forward). All age groups suffer concussions, from the very young to the
elderly. Certain
activities are more frequently associated with concussions, including
athletics and military
service, but they also result from general trauma caused by motor vehicle
collisions, falls from
height and assaults. Concussions often result in significant acute symptoms
and in some
individuals, long-term neurological dysfunction.
A pressure-wave (e.g., bomb blast) may cause the full severity range of TBI,
from mild to
severe, and may include penetrating injury from projectiles. The
pathophysiology of blast-related
TBI is distinctive, with injury magnitude dependent on several factors,
including blast energy
and distance from the blast epicenter (Rosenfeld, et al., Lancet Neurol. 2013
Sep;12(9):882-93.).
A blast injury is a complex type of physical trauma resulting from direct or
indirect exposure to
an explosion. (Rosenfeld, et al., Lancet Neurol. 2013 Sep;12(9):882-93.)
Primary injuries are
caused by blast overpressure waves, or shock waves. These are especially
likely when a person is
close to an exploding munition, such as a land mine. Animal models suggest
that the brain is
vulnerable to primary blast injury. Shear and stress waves from the over-
pressurization could
potentially cause TBI directly (e.g., concussion, hemorrhage, edema, diffuse
axonal injury). The
primary blast mechanism can also result in cerebral infarction due to blast
lung injury and
consequent formation of gas emboli. ["Blast Injuries: Traumatic Brain Injuries
from
Explosions", Brainline.org]
While diagnosis of moderate to severe TBI is straightforward, mild TBI is
under-
diagnosed following concussion and explosive events. ["Blast Injuries:
Traumatic Brain Injuries
from Explosions", Brainline.org] That is, while moderate and severe TBI are
easily diagnosed
based on clinical signs, mild TB1 can be missed due to subtle, transient or
absent clinical signs.
The latter require an objective diagnostic, such as a blood test that is
sensitive, specific and
reproducible.
2
CA 02980376 2017-09-20
WO 2016/149808 PCT/CA2016/050310
Diagnosis of clinically significant mTBI can be difficult, as are the
decisions to stop play
or activities. It is also unclear when mTBI patients should return to daily
activities. Thus, there
is great interest in discovery of biomarkers to aid in mTBI, including primary
brain blast injury
and concussion diagnoses, prognoses and rehabilitation. At present, no single
biomarker has
sufficient sensitivity and specificity.
Non-traumatic brain injuries (non-TB I) can also result in mildly abnormal
neurological
symptoms. Given the often subtle nature of non-TBI injuries, they could be
better identified
with an objective diagnostic test, such as a blood test, that is sensitive,
specific and reproducible.
Traumatic spinal cord injuries (TSI; e.g injuries from spine hyperflexion,
hyperextension,
lateral stress, rotation, compression, distraction and partial spinal cord
transection; often from
motor vehicle collisions, falls from height, sports, etc.) and non-traumatic
spinal cord injuries
(non-TSI; e.g, intervertebral disk disease, interruption of blood supply,
infection, electrocution,
cancer, radiation, etc) can also result in mild peripheral symptoms (e.g., an
"incomplete" injury).
Given the often subtle nature of TSI and non-TSI injuries, they could be
better identified with an
objective diagnostic test, such as a blood test, that is sensitive, specific
and reproducible.
Metabolomics is relatively new field of study that measures a person's small
metabolite
profile (<1500 Daltons). Two common methods for metabolomics are nuclear
magnetic
resonance (NMR) spectroscopy and mass spectrometry (MS). The former measures a
large
number of metabolites, but lacks sensitivity (micromolar range), while the
latter is very sensitive
for quantifying amino acids, acylcarnitines, glycerophospholipids,
sphingolipids and sugars
(picomolar range). The allure of metabolomics lies with the concept that
metabolites fall
downstream of genetic, transcriptomic, proteomic, and environmental variation,
thus providing
the most integrated and dynamic measure of phenotype and medical condition.
SUMMARY OF THE INVENTION
The present invention relates to the use metabolomic profiling or individual
metabolites
as biomarkers to diagnose central nervous system (CNS) injuries, including
acquired brain injury
(ABH and acquired spinal injury (ASI). These injuries can be traumatic (mTBI
and mTSI) and
non-traumatic (non-TBI and non-TSI) including concussion or contusion, blast
injury, as well as
stroke, poisoning, psychological distress, chemical, infection, inflammation,
autoimmune,
3
CA 02980376 2017-09-20
WO 2016/149808 PCT/CA2016/050310
degenerative, hypoxic, ischemic, metabolic and cancer/radiation-induced
brain/spinal injuries.
The present invention relates to the use metabolomic profiling or individual
metabolites as
biomarkers to specifically diagnose brain and/or spinal cord injuries. Solely
for the purpose of
this document, the term "ACNSF (acquired CNS injury) will be used to mean "AEI
and/or
ASP'. Also, non-CNSI (non-CNS injury) will be used to mean normal or control
subject.
In one embodiment, the present invention is a method of diagnosing ACNSI in a
subject
including: (a) obtaining a metabolite profile from the subject; and (b) using
multivariate
statistical analysis and machine learning to compare the subject's profile
with a predetermined
set of metabolite profiles of ACNSI and a predetermined set of metabolite
profiles of non-CNSI
to diagnose if the subject has ACNSI.
In one embodiment of the method of diagnosing ACNSI, the predetermined set of
ACNSI
and non-ACNSI metabolite profiles are obtained by obtaining a first metabolite
profile from a
population of subjects known to have ACNSI and a second metabolite profile
from a population
of control non- ACNSI (referred to as "normal") subjects .
In another embodiment of the method of diagnosing ACNSI, the metabolite
profile of the
subject and the first and second predetermined sets of ACNSI and non-ACNSI
profiles are
provided as sets of multi-dimensional metabolomics data, and wherein step (b)
comprises
applying to the sets of multi-dimensional metabolomics data (i) a
dimensionality reduction, (ii) a
feature selection, or (iii) both dimensionality reduction and feature
selection, to obtain a reduced
metabolomics data set.
In another embodiment of the method of diagnosing ACNSI, step (b) comprises
normalizing the set metabolite profile of the subject and the sets of
predetermined metabolite
profiles of ACNSI and non-ACNSI to obtain matrix, and performing principal
components
analysis directly on the metabolite matrix.
In another embodiment, the present invention is a method of diagnosing ACNSI
in a
subject including: (a) obtaining a metabolite profile from the subject; (b)
creating a matrix of
pairwise correlations between the metabolite profile of the subject and a
predetermined set of
ACNSI profiles and a predetermined set of non-ACNSI profiles and identifying
ACNSI and non-
ACNSI clusters in the correlation matrix; and (c) determining if the subject's
profile falls within
4
CA 02980376 2017-09-20
WO 2016/149808 PCT/CA2016/050310
the ACNSI cluster or the non-ACNSI cluster.
In one embodiment of the previous method of diagnosing ACNSI in a subject, the
predetermined ACNSI and non-ACNSI sets of metabolite profiles are obtained
respectively by
obtaining a first set of metabolite profiles from a population of subjects
known to have ACNSI
and a second set of metabolite profiles from a population of control non-
ACNSI (normal)
subjects.
In another embodiment, the present invention is a method of tracking or
following the
efficiency of a medical intervention (including rehabilitation therapy) in an
ACNSI patient, the
method including: (a) obtaining metabolite profiles from the patient at
different times during the
medical intervention (rehabilitation therapy); and (b) using multivariate
statistical analysis and
machine learning to compare the patient's profiles at each of the different
times with a
predetermined set of metabolite profiles of ACNSI and a predetermined set of
metabolite profiles
of non-ACNSI to follow the efficiency of the medical intervention
(rehabilitation therapy) in the
patient.
In one embodiment of the method of tracking the efficiency of a medical
intervention
(including rehabilitation therapy) in an ACNSI patient of the present
invention, the
predetermined set of ACNSI and non-ACNSI metabolite profiles are obtained by
obtaining a
first metabolite profile from a population of subjects known to have ACNSI and
a second
metabolite profile from a population of control non-ACNSI (referred to as
"normal") subjects.
In another embodiment of the method of tracking the efficiency of a medical
intervention
(including rehabilitation therapy) in an ACNSI patient of the present
invention, the metabolite
profiles of the patient and the first and second predetermined sets of ACNSI
and non-ACNSI
metabolite profiles are provided as sets of multi-dimensional metabolomics
data, and wherein
step (b) comprises applying to the sets of multi-dimensional metabolomics data
(i) a
dimensionality reduction, (ii) a feature selection, or (iii) both
dimensionality reduction and
feature selection, to obtain a reduced metabolomics data set.
In another embodiment of the method of tracking or following the efficiency of
a medical
intervention (including rehabilitation therapy) in an ACNSI patient of the
present invention, step
(b) comprises normalizing the metabolite profiles of the patient and the sets
of predetermined
CA 02980376 2017-09-20
WO 2016/149808 PCT/CA2016/050310
metabolite profiles of ACNSI and non-ACNSI to obtain matrix, and performing
principal
components analysis directly on the metabolite matrix.
In another embodiment of the method of tracking the efficiency of a medical
intervention
(including rehabilitation therapy) in an ACNSI patient of the present
invention, the
predetermined set of metabolite profiles of ACNSI and non-ACNSI are matched
for one or more
of: age, sex, activity, body habitus, nutrition, medications and morbidity.
In another embodiment of the method of tracking the efficiency of a medical
intervention
(including rehabilitation therapy) in an ACNSI patient of the present
invention, the patient's
metabolite profile and the predetermined set of metabolite profiles are
obtained using
metabolomics.
In another embodiment of the method of tracking the efficiency of a medical
intervention
(including rehabilitation therapy) in an ACNSI patient of the present
invention, the
metabolomics is performed with one or more of high performance liquid
chromatography, thin
layer chromatography, electrochemical analysis, mass spectroscopy (MS),
refractive index
spectroscopy, ultra-violet spectroscopy, fluorescent analysis, radiochemical
analysis, near-
infrared spectroscopy, nuclear magnetic resonance (NMR), light scattering
analysis, gas
chromatography (GC), or GC coupled with MS, direct injection (DI) coupled with
LC-MS/MS.
In another embodiment of the method of tracking the efficiency of a medical
intervention
(including rehabilitation therapy) in an ACNSI patient of the present
invention, the obtaining,
using, creating and determining steps are executed using a suitably programmed
computer.
In one embodiment of the method according to any one of the previous
embodiment, the
predetermined profile of ACNSI and non-ACNSI are matched for one or more of:
age, sex,
activity, nutrition, body habitus, medications and co-morbidity.
In another embodiment of the methods according to any one of the previous
embodiment,
the subject's/patient's metabolite (including lipids and fatty acids) profile
and the predetermined
set of metabolite profiles are obtained using metabolomics.
In another embodiment of the methods according to any one of the previous
embodiment,
the metabolomics (including lipids and fatty acids) is performed with one or
more of high
6
CA 02980376 2017-09-20
WO 2016/149808 PCT/CA2016/050310
performance liquid chromatography, thin layer chromatography, electrochemical
analysis, mass
spectroscopy (MS), refractive index spectroscopy, ultra-violet spectroscopy,
fluorescent analysis,
radiochemical analysis, near-infrared spectroscopy, nuclear magnetic resonance
(NMR), light
scattering analysis, gas chromatography (GC), or GC coupled with MS, direct
injection (DI)
coupled with LC-MS/MS.
In another embodiment of the methods according to any one of the previous
embodiment,
the obtaining, using, creating and determining steps are executed using a
suitably programmed
computer.
In another embodiment of the methods according to any one of the previous
embodiment,
the metabolite profiles are obtained from a biological test sample selected
from the group
consisting of: blood, blood plasma, blood serum, saliva, cynovial fluid,
urine, spinal fluid,
bronchoalveolar lavage and extracts. In one aspect, the metabolite includes
phospholipids,
glycerophospholipids, lipids, plasmalogens, fatty acids, sugars, amino acids,
nucleotides,
intermediates formed during cellular processes, or combinations thereof. In
another aspect, the
metabolite includes lipids and fatty acids or combinations thereof.
In another embodiment of the methods according to any one of the previous
embodiment,
the metabolite profiles include the following metabolites: C5, PC an C32:1, PC
aa C32:2, PC aa
C36:5, PC aa C36:6, PC ae C34:0, PC ae C34:3, PC ae C36:0, PC ae C36:1, PC ae
C36:2, PC ae
C38:1, PC ae C38:2, PC ae C38:3, Putrescine, Formate, Methanol, and Succinate.
In another embodiment of the methods according to any one of the previous
embodiment,
the metabolite profiles include the following metabolites: C5, PC aa C30:2, PC
aa C32:0, PC aa
C32:1, PC aa C32:2, PC aa C32:3, PC aa C34:4, PC aa C36:6, PC aa C42:6, PC ae
C30:0, PC ae
C30:1, PC ae C32:1, PC ae C34:0, PC ae C34:2, PC ae C34:3, PC ae C36:0, PC ae
C36:2, PC ae
C38:1, PC ae C38:3, SM C22:3, SM C24:0, SM C24:1, alpha-Aminoadipic acid,
trans-OH-
Proline, Putrescine, Betaine, Formate, Glucose, Glycerol, Methanol, and
Serine.
In another embodiment of the methods according to any of the previous
embodiments of
the present invention, the ACNSI is selected from mTSI and non-TSI. In one
aspect of this
embodiment, the mTSI includes spinal cord contusion, stretch and/or partial
transection, and the
non-TSI includes injuries caused by intervertebral disk disease, electricity,
stroke, poisoning,
7
CA 02980376 2017-09-20
WO 2016/149808 PCT/CA2016/050310
chemical, infectious, ischemia, metabolic, inflammatory, autoimmune,
degenerative, hypoxic,
and cancer/radiation-induced spinal cord injuries.
In another embodiment of the methods according to any of the previous
embodiments of
the present invention, the ACNSI is selected from mTBI and non-TBI.
In another embodiment of the methods according to any one of the previous
embodiment,
the ACNSI is mTBI. In one aspect of this embodiment the mTBI is concussion or
primary blast
in blast-induced traumatic brain injury.
In another embodiment of the methods according to any of the previous
embodiments of
the present invention, the ACNSI is non-TB!. In one aspect of this embodiment,
the non-TB1 is
selected from electrical-induced brain injury (electrocution), seizure-induced
brain injury,
surgical-induced brain injury, stroke-induced brain injury, poison-induced
brain injury,
psychological brain injury, chemical brain injury, infectious brain injury,
ischemic brain injury,
metabolic brain injury, inflammatory brain injury, autoimmune brain injury,
degenerative brain
injury, hypoxic brain injury, and cancer/radiation-induced brain injury.
In another embodiment of the methods according to any one of the previous
embodiment,
the ACNSI is concussion.
In another embodiment of the methods according to any one of the previous
embodiment,
the ACNSI is primary blast in blast-induced traumatic brain injury.
In another embodiment, the present invention is a computer program product for
use in
conjunction with a computer system, the computer program product including a
computer
readable storage medium and a computer program mechanism embedded therein, the
computer
program mechanism comprising executable instructions for performing a method
of diagnosing
ACNSI in a subject, said executable instructions comprising: (a) using
multivariate statistical
analysis and machine learning to compare a subject's metabolic profile with a
predetermined set
of ACNSI metabolic profiles and a predetermined set of normal metabolic
profiles; and (b)
determining if the subject has ACNSI based on said comparison.
In one embodiment of the computer program product of the present invention,
the
program mechanism further comprises executable instructions for: (i)
identifying metabolites in
8
CA 02980376 2017-09-20
WO 2016/149808 PCT/CA2016/050310
a first set of biological samples from a population of subjects known to have
ACNSI and in a
second set of biological samples from a population of control non-ACNSI
(referred to as
''normal') subjects thereby obtaining the predetermined ACNSI profile and the
predetermined
normal profile using the ACNSI and normal metabolite matrices.
In another embodiment of the computer program product of the present
invention, an
initial dimensionality reduction is performed on the subject's metabolite
profile and in the
predetermined ACNSI and normal profiles by t-SNE.
In another embodiment of the computer program product according to any of the
previous embodiments of the present invention, the ACNSI is selected from mTSI
and non-TSI.
In one aspect of this embodiment, the mTSI includes spinal cord contusion,
stretch and/or partial
transection, and the non-TSI includes injuries caused by intervertebral disk
disease, electricity,
stroke, poisoning, chemical, infectious, ischemia, metabolic, inflammatory,
autoimmune,
degenerative, hypoxic, and cancer/radiation-induced spinal cord injuries.
In another embodiment of the computer program product according to any of the
previous embodiments of the present invention, the ACNSI is selected from mTBI
and non-TBI.
In another embodiment of the computer program product according to any of the
previous embodiments of the present invention, the ACNSI is mTBI. In one
aspect of this
embodiment the mTBI is concussion or primary blast in blast-induced traumatic
brain injury.
In another embodiment of the computer program product according to any of the
previous embodiments of the present invention, the ACNSI is non-TBI. In one
aspect of this
embodiment, the non-TBI is selected from electrical-induced brain injury
(electrocution),
seizure-induced brain injury, surgical-induced brain injury, stroke-induced
brain injury, poison-
induced brain injury, psychological brain injury, chemical brain injury,
infectious brain injury,
ischemic brain injury, metabolic brain injury, inflammatory brain injury,
autoimmune brain
injury, degenerative brain injury, hypoxic brain injury, and cancer/radiation-
induced brain injury.
In another embodiment, the present invention provides for a method of
assessing a non-
human animal model of human ACNSI, the method including: (a) obtaining a
metabolite profile
from the non-human animal model of ACNSI; and (b) using multivariate
statistical analysis and
9
CA 02980376 2017-09-20
WO 2016/149808 PCT/CA2016/050310
machine learning to compare the non-human animal model profile with a
predetermined set of
metabolite profiles of human ACNSI and a predetermined set of metabolite
profiles of human
non- ACNSI to determine if the non-human animal classifies as ACNSI.
In one embodiment of the method of assessing a non-human animal model of
ACNSI, the
predetermined sets of human ACNSI and non-ACNSI metabolite profiles are
obtained by
obtaining a first metabolite profile from a population of subjects known to
have ACNSI and a
second metabolite profile from a population of control non- ACNSI (referred to
as "normal")
subjects.
In another embodiment of the method of assessing a non-human animal model of
ACNSI,
the metabolite profile of the non-human animal model of ACNSI and the first
and second
predetermined sets of ACNSI and non-ACNSI profiles are provided as sets of
multi-dimensional
metabolomics data, and wherein step (b) comprises applying to the sets of
multi-dimensional
metabolomics data (i) a dimensionality reduction, (ii) a feature selection, or
(iii) both
dimensionality reduction and feature selection, to obtain a reduced
metabolomics data set.
In another embodiment of the method of assessing a non-human animal model of
ACNSI,
step (b) comprises normalizing the set metabolite profile of the non-human
animal and the sets of
predetermined metabolite profiles of ACNSI and non-ACNSI to obtain matrix, and
performing
principal components analysis directly on the metabolite matrix.
In another embodiment of assessing a non-human animal model of ACNSI according
to
any of the previous embodiments of the present invention, the ACNSI is
selected from mTSI and
non-TSI. In one aspect of this embodiment, the mTS1 includes spinal cord
contusion, stretch
and/or partial transection, and the non-traumatic spinal cord injuries
includes injuries caused by
intervertebral disk disease, electricity, stroke, poisoning, chemical,
infectious, ischemia,
metabolic, inflammatory, autoimmune, degenerative, hypoxic, and
cancer/radiation-induced
spinal cord injuries.
In another embodiment of the method of assessing a non-human animal model of
ACNSI
according to any of the previous embodiments of the present invention, the
ACNSI is selected
from mTB1 and non-TB1.
CA 02980376 2017-09-20
WO 2016/149808 PCT/CA2016/050310
In another embodiment of the method of assessing a non-human animal model of
ACNSI
according to any of the previous embodiments of the present invention, the
ACNSI is mTBI. In
one aspect of this embodiment the mTBI is concussion or primary blast in blast-
induced
traumatic brain injury
In another embodiment of the method of assessing a non-human animal model of
ACNSI
according to any of the previous embodiments of the present invention, the
ACNSI is non-TBI.
In one aspect of this embodiment, the non-TBI is selected from stroke-induced
brain injury,
poison-induced brain injury, psychological brain injury, chemical brain
injury, infectious brain
injury, ischemic brain injury, metabolic brain injury, inflammatory brain
injury, autoimmune
brain injury, degenerative brain injury, hypoxic brain injury, and
cancer/radiation-induced brain
injury.
BRIEF DESCRIPTION OF THE DRAWINGS
The following figures illustrate various aspects and preferred and alternative
embodiments of the invention.
FIG. 1: Graph of individual subjects plotted in the reduced 2-dimensional
space to
illustrate the power of the t-SNE dimensionality reduction step (12 concussed
subjects ¨ filled
circles, 17 control subjects ¨ open circles).
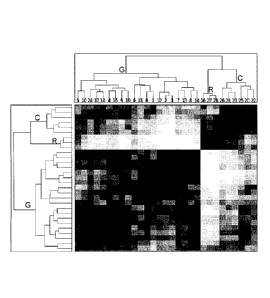
FIG. 2: Graph illustrating agglomerative complete-linkage hierarchical
clustering,
yielding 3 top level clusters: Green ("G") cluster ¨ all concussed, but 2,
Cyan ("C") cluster ¨ all
concussed, Red ("R") cluster ¨ two concussed, one control).
FIG. 3: Graph illustrating a Receiver Operating Curve (ROC). Note that the
curves for
ROC fold 0, ROC fold 1 and ROC fold 2 are superimposed.
FIG. 4: Graph of individual animals plotted in a 3-dimensional scatter plot of
the leading
3 components (15 blast animals ¨ filled circle, 15 control animals ¨
FIG. 5: Graph of individual subjects plotted in the reduced 2-dimensional
space to
illustrate the power of the t-SNE dimensionality reduction step (blast rats ¨
open circles, control
rats ¨ filled circles).
FIG. 6: Pearson product-moment coefficient to pairwise compare metabolite
profiles
11
CA 02980376 2017-09-20
WO 2016/149808 PCT/CA2016/050310
between subjects.
FIG. 7: Graph illustrating agglomerative complete-linkage hierarchical
clustering,
yielding 2 top level clusters: blast ("B") cluster (n----15), and control (C)
cluster (n=15).
FIG. 8: Graph illustrating the approach to data analytics and modelling used
in the
embodiments of the present invention.
DESCRIPTION OF THE INVENTION
Abbreviations
Table of MS Metabolites
CO (Carnitine) Acylcarnitines
Cl 0 (Decanoyl carnitine) Acylcarnitines
C10:1 (Decenoylcamitine) Acylcarnitines
C10:2 (Decadi enylcarnitine) Acylcarnitines
C12 (Dodecanoylcarnitine) Acylcarnitines
C12-DC (Dodecanedioylcamitine) Acylcarnitines
C12:1 (Dodecenoylcarnitine) Acylcarnitines
C14 (Tetradecanoylcamitine) Acylcarnitines
C14:1 (Tetradecenoyl carnitine) Acylcarnitines
C14:1-0H (Hydroxytetradecenoyl carnitine) Acylcarnitines
C14 :2 (Tetradecadi en yl carnitine) Acylcarnitines
C14:2-0H (Hydroxytetradecadienylcamitine) Acylcarnitines
C16 (Hexadecanoylcamitine) Acylcarnitines
C16-0H (Hydroxyhexadecanoylcamitine) Acylcarnitines
C1611 (Hexadecenoylcamitine) Acylcarnitines
C16 : 1-0H (Hydroxyhexadecenoylcamitine) Acylcarnitines
C16:2 (Hexadecadienylcarnitine) Acylcarnitines
C16 :2-0H (Hydroxyhexadecadienylcarnitine) Acylcarnitines
C18 (Octadecanoylcarnitine) Acylcarnitines
C18:1 (Octadecenoylcamitine) Acylcarnitines
C18 :1-0H (Hydroxyoctadecenoylcarnitine) Acylcarnitines
C18:2 (Octadecadi enylcamitine) Acylcarnitines
C2 (Acetyl carnitine) Acylcarnitines
C3 (Propionylcarnitine) Acylcarnitines
C3-01-1 (Hydroxypropi onyl carni tine) Acylcarnitines
C3:1 (Propenoylcarnitine) Acylcarnitines
12
CA 02980376 2017-09-20
WO 2016/149808
PCT/CA2016/050310
C4 (Butyrylcarnitine) Acylcarnitines
C4-OH (C3-DC) (Hydroxybutyrylcarnitine) Acylcarnitines
C4:1 (Butenylcarnitine) Acylcarnitines
C5 (Valerylcarnitine) Acylcarnitines
C5-DC (C6-0H)(Glutarylcarnitine) Acylcarnitines
C5-M-DC (Methylglutarylcarnitine) Acylcarnitines
C5-0H (C3-DC-M) (Hydroxyvalerylcarnitine) Acylcarnitines
C5:1 (Tiglylcarnitine) Acylcarnitines
C5 :1-DC (Glutaconylcarnitine) Acylcarnitines
C6 (C4: 1 -DC) (Hexanoylcamitine) Acylcarnitines
C6: 1 (Hexenoylcarnitine) Acylcarnitines
C7-DC (Pimelylcarnitine) Acylcarnitines
C8 (Octanoylcarnitine) Acylcarnitines
C9 (N onaylcarnitine) Acylcarnitines
Alanine Amino Acids
Arginine Amino Acids
Asparagine Amino Acids
Aspartate Amino Acids
Citrulline Amino Acids
Glutamate Amino Acids
Glutamine Amino Acids
Glycine Amino Acids
Histidine Amino Acids
Isoleucine Amino Acids
Leucine Amino Acids
Lysine Amino Acids
Methionine Amino Acids
Ornithine Amino Acids
Phenyl al anine Amino Acids
Proline Amino Acids
S erine Amino Acids
Threonine Amino Acids
Tryptophan Amino Acids
Tyrosine Amino Acids
Valine Amino Acids
Acetyl orni thin e Biogenic amines
Aminoadipic acid Biogenic amines
13
CA 02980376 2017-09-20
WO 2016/149808
PCT/CA2016/050310
Asymmetric dimethylarginine Biogenic amines
Carnosine Biogenic amines
Creatinine Biogenic amines
Dopa Biogenic amines
Dopamine Biogenic amines
Histamine Biogenic amines
Hydroxyproline Biogenic amines
Kynurenine Biogenic amines
Methionine sulfoxide Biogenic amines
Nitrotyrosine Biogenic amines
Phenyl ethyl amine Biogenic amines
Putrescine Biogenic amines
Sarcosine Biogenic amines
Serotonin Biogenic amines
Spermidine Biogenic amines
Spermine Biogenic amines
Symmetric dimethylarginine Biogenic amines
Taurine Biogenic amines
Total dimethylarginine Biogenic amines
14exose Carbohydrates
lysoPC a C14:0 Phospholipids
lysoPC a C16:0 Phospholipids
lysoPC a C16:1 Phospholipids
lysoPC a C17:0 Phospholipids
lysoPC a C18:0 Phospholipids
lysoPC a C18:1 Phospholipids
lysoPC a C18:2 Phospholipids
lysoPC a C20:3 Phospholipids
lysoPC a C20:4 Phospholipids
lysoPC a C24:0 Phospholipids
lysoPC a C26:0 Phospholipids
lysoPC a C26:1 Phospholipids
lysoPC a C28:0 Phospholipids
lysoPC a C28:1 Phospholipids
PC aa C24:0 Phospholipids
PC aa C26:0 Phospholipids
PC aa C28:1 Phospholipids
14
CA 02980376 2017-09-20
WO 2016/149808
PCT/CA2016/050310
PC aa C30:0 Phospholipids
PC aa C30:2 Phospholipids
PC aa C32:0 Phospholipids
PC aa C32:1 Phospholipids
PC aa C32:2 Phospholipids
PC aa C32:3 Phospholipids
PC aa C34:1 Phospholipids
PC aa C34:2 Phospholipids
PC aa C34:3 Phospholipids
PC aa C34:4 Phospholipids
PC aa C36:0 Phospholipids
PC aa C36:1 Phospholipids
PC aa C36:2 Phospholipids
PC aa C36:3 Phospholipids
PC aa C36:4 Phospholipids
PC aa C36:5 Phospholipids
PC aa C36:6 Phospholipids
PC aa C38:0 Phospholipids
PC aa C38:1 Phospholipids
PC aa C38:3 Phospholipids
PC aa C38:4 Phospholipids
PC aa C385 Phospholipids
PC aa C38:6 Phospholipids
PC aa C40:1 Phospholipids
PC aa C40:2 Phospholipids
PC aa C40:3 Phospholipids
PC aa C40:4 Phospholipids
PC aa C40:5 Phospholipids
PC aa C40:6 Phospholipids
PC aa C42:0 Phospholipids
PC aa C42:1 Phospholipids
PC aa C42:2 Phospholipids
PC aa C42:4 Phospholipids
PC aa C42:5 Phospholipids
PC aa C42:6 Phospholipids
PC ae C30:0 Phospholipids
PC ae C30:1 Phospholipids
CA 02980376 2017-09-20
WO 2016/149808
PCT/CA2016/050310
PC ae C32:1 Phospholipids
PC ae C32:2 Phospholipids
PC ae C34:0 Phospholipids
PC ae C34:1 Phospholipids
PC ae C34:2 Phospholipids
PC ae C34:3 Phospholipids
PC ae C36:0 Phospholipids
PC ae C36:1 Phospholipids
PC ae C36:2 Phospholipids
PC ae C36:3 Phospholipids
PC ae C36:4 Phospholipids
PC ae C36:5 Phospholipids
PC ae C38:0 Phospholipids
PC ae C38:1 Phospholipids
PC ae C38:2 Phospholipids
PC ae C38:3 Phospholipids
PC ae C38:4 Phospholipids
PC ae C38:5 Phospholipids
PC ae C38:6 Phospholipids
PC ae C40:1 Phospholipids
PC ae C40:2 Phospholipids
PC ae C40:3 Phospholipids
PC ae C40:4 Phospholipids
PC ae C40:5 Phospholipids
PC ae C40:6 Phospholipids
PC ae C42:0 Phospholipids
PC ae C42:1 Phospholipids
PC ae C42:2 Phospholipids
PC ae C42:3 Phospholipids
PC ae C42:4 Phospholipids
PC ae C42:5 Phospholipids
PC ae C44:3 Phospholipids
PC ae C44:4 Phospholipids
PC ae C44:5 Phospholipids
PC ae C44:6 Phospholipids
SM (OH) C14:1 Sphingolipids
SM (OH) C16:1 Sphingolipids
16
CA 02980376 2017-09-20
WO 2016/149808 PCT/CA2016/050310
SM (OH) C22:1 Sphingolipids
SM (OH) C22:2 Sphingolipids
SM (OH) C24:1 Sphingolipids
SM C16:0 Sphingolipids
SM C16:1 Sphingolipids
SM C18:0 Sphingolipids
SM C18:1 Sphingolipids
SM C20:2 Sphingolipids
SM C22:3 Sphingolipids
SM C24:0 Sphingolipids
SM C24:1 Sphingolipids
SM C26:0 Sphingolipids
SM C26:1 Sphingolipids
Definitions
Unless defined otherwise, all technical and scientific terms used herein have
the same
meaning as commonly understood by one of ordinary skill in the art to which
this invention
belongs. Also, unless indicated otherwise, except within the claims, the use
of "or" includes
"and" and vice versa. Non-limiting terms are not to be construed as limiting
unless expressly
stated or the context clearly indicates otherwise (for example "including",
"having" and
"comprising" typically indicate "including without limitation"). Singular
forms including in the
claims such as "a", "an" and "the" include the plural reference unless
expressly stated otherwise.
In order to aid in the understanding and preparation of the within invention,
the following
illustrative, non-limiting, examples are provided.
In this document the definition of "mild traumatic brain injury" "mTBI" ",
which may
also be referred to in the literature as mild head injury or concussion, is
that taken from the
American Congress of Rehabilitation Medicine (ACRM; J Head Trauma Rehabil
1993;8(3):86-
87), and it refers to a person who has had a traumatically induced
physiological disruption of
brain function, as manifested by at least one of the following: 1. any period
of loss of
consciousness; 2. any loss of memory for events immediately before or after
the event; 3. any
alteration in mental state at the time of the event (eg, feeling dazed,
disoriented, or confused);
and 4. focal neurological deficit(s) that may or may not be transient; but
where the severity of the
17
CA 02980376 2017-09-20
WO 2016/149808 PCT/CA2016/050310
injury does not exceed the following: loss of consciousness of approximately
30 minutes or less;
after 30 minutes, an initial Glasgow Coma Scale (GCS) of 13-15; and
posttraumatic amnesia
(PTA) not greater than 24 hours. This definition includes: 1. the head being
struck, 2. the head
striking an object, and 3. the brain undergoing an acceleration/deceleration
movement (ie,
whiplash) without direct external trauma to the head. Computed tomography,
magnetic
resonance imaging, electroencephalogram, near infrared spectroscopy, positive
emission
tomography or routine neurological evaluations may be normal. Due to the lack
of medical
emergency, or the realities of certain medical systems, some patients may not
have the above
factors medically documented in the acute stage. In such cases, it is
appropriate to consider
symptomatology that, when linked to a traumatic head injury, can suggest the
existence of a
mTBI.
"Non-traumatic brain injuries" (non-TBI) include brain injuries that may be
the result of
strokes, poisonings, psychological distresses, chemicals, infections,
inflammation, autoimmune
diseases, degenerative processes, h ypoxi a, ischemia, metabolic derangements
and
cancer/radiation.
In this document the definition of "mild traumatic spinal cord injury" "mTSI"
is an
incomplete injury with one or more spinal symptoms that may resolve over time
(e.g. loss of
bowel or bladder control, poor regulation of blood pressure and body
temperature, pain, poor
sensation, poor sense of body position, sexual dysfunction, etc.). Causes of
mTSI may include
contusion, stretch and partial cord transection.
"Non-traumatic spinal cord injuries" (non-TSI) include spinal cord injuries
that may be
the result of strokes, poisonings, chemicals, infections, inflammation,
autoimmune diseases,
degenerative processes, hypoxia, ischemia, metabolic derangements and
cancer/radiation.
"Metabolome" refers to the collection of all metabolites in a biological cell,
tissue, organ
or organism, which are the end products of cellular processes. "Metabolome"
includes lipidome,
sugars, nucleotides and amino acids. Lipidome is the complete lipid profile in
a biological cell,
tissue, organ or organism.
"Metabolomic profiling" refers to the characterization and/or measurement of
the small
molecule metabolites in biological specimen or sample, including cells,
tissue, organs,
18
CA 02980376 2017-09-20
WO 2016/149808 PCT/CA2016/050310
organisms, or any derivative fraction thereof and fluids such as blood, blood
plasma, blood
serum, saliva, synovial fluid, spinal fluids, urine, bronchoalveolar lavage,
tissue extracts and so
forth.
The metabolite profile may include information such as the quantity and/or
type of small
molecules present in the sample. The ordinarily skilled artisan would know
that the information
which is necessary and/or sufficient will vary depending on the intended use
of the "metabolite
profile." For example, the "metabolite profile," can be determined using a
single technique for an
intended use but may require the use of several different techniques for
another intended use
depending on such factors as the disease state involved, the types of small
molecules present in a
particular targeted cellular compartment, the cellular compartment being
assayed per se., and so
forth.
The relevant information in a "metabolite profile" may also vary depending on
the
intended use of the compiled information, e.g. spectrum. For example for some
intended uses,
the amounts of a particular metabolite or a particular class of metabolite may
be relevant, but for
other uses the distribution of types of metabolites may be relevant.
Metabolite profiles may be generated by several methods, e.g., HPLC, thin
layer
chromatography (TLC), electrochemical analysis, Mass Spectroscopy (MS),
refractive index
spectroscopy (RI), Ultra-Violet spectroscopy (UV), fluorescent analysis,
radiochemical analysis,
Near-InfraRed spectroscopy (Near-1R), Nuclear Magnetic Resonance spectroscopy
(NMR),
fluorescence spectroscopy, dual polarisation interferometry, computational
methods, Light
Scattering analysis (LS), gas chromatography (GC), or GC coupled with MS,
direct injection
(DI) coupled with LC-MS/MS and/or other methods or combination of methods
known in the
art.
The term "small molecule metabolites" includes organic and inorganic molecules
which
are present in the cell, cellular compartment, or organelle, usually having a
molecular weight
under 2,000, or 1,500. The term does not include large macromolecules, such as
large proteins
(e.g., proteins with molecular weights over 2,000, 3,000, 4,000, 5,000, 6,000,
7,000, 8,000,
9,000, or 10,000), large nucleic acids (e.g., nucleic acids with molecular
weights of over 2,000,
3,000, 4,000, 5,000, 6,000, 7,000, 8,000, 9,000, or 10,000), or large
polysaccharides (e.g.,
19
CA 02980376 2017-09-20
WO 2016/149808 PCT/CA2016/050310
polysaccharides with a molecular weights of over 2,000, 3,000, 4,000, 5,000,
6,000, 7,000,
8,000, 9,000, or 10,000). The small molecule metabolites of the cell are
generally found free in
solution in the cytoplasm or in other organelles, such as the mitochondria,
where they form a
pool of intermediates which can be metabolized further or used to generate
large molecules,
called macromolecules. The term "small molecule metabolites" includes
signaling molecules and
intermediates in the chemical reactions that transform energy derived from
food into usable
forms. Examples of small molecule metabolites include phospholipids,
glycerophospholipids,
lipids, plasmalogens, sugars, fatty acids, amino acids, nucleotides,
intermediates formed during
cellular processes, isomers and other small molecules found within the cell.
In one embodiment,
the small molecules of the invention are isolated. Preferred metabolites
include lipids and fatty
acids.
The term "subject" as used herein refers all members of the animal kingdom
including
mammals, preferably humans.
The term "patient" as used herein refers to a subject that is suspected of
having an
acquired injury of the central nervous system (ACNSI). In this document ACNSI
includes an
acquired brain injury (ABI) and an acquired spinal cord injury (ASI). These
injuries may be
traumatic (mTBI and mTSI) and non-traumatic (non-TBI and non-TSI). mTBI
includes
concussion and blast, including blast overpressure wave injury. Non-TBI
includes electrical-
induced brain injury (electrocution), seizure-induced brain injury, surgical-
induced brain injury,
stroke-induced brain injury, poison-induced brain injury, psychological brain
injury, chemical
brain injury, infectious brain injury, ischemic brain injury, metabolic brain
injury, inflammatory
brain injury, autoimmune brain injury, degenerative brain injury, hypoxic
brain injury, and
cancer/radiation-induced brain injury. mTSI includes spinal cord contusion,
stretch and/or partial
transection, and the non-TSI includes intervertebral disk disease, electrical,
stroke, poisoning,
chemical, infectious, ischemia, metabolic, inflammatory, autoimmune,
degenerative, hypoxic,
and cancer/radiation-induced spinal cord injuries.
Overview
The present invention relates to the use metabolomic profiling in diagnosing
acquired
central nervous system injuries (ACNSI), including AB1 and ASI. ABI includes
mTBI and non-
CA 02980376 2017-09-20
WO 2016/149808 PCT/CA2016/050310
TBI. AS1 includes mTSI and non-TSI. Traumatic injuries to the brain and spinal
cord may
include concussion and blast, including blast overpressure wave injury as well
as spinal cord
contusion, stretch and/or partial transection. Non-traumatic injuries (non-TBI
and non-TSI) may
include electrical-induced (electrocution), seizure-induced, surgical-induced,
strokes, poisonings,
psychological distresses, chemicals, infections, inflammation, autoimmune
diseases,
degenerative processes, hypoxia, ischemia, metabolic derangements and
cancer/radiation (also,
intervertebral disk disease for non-TSI). The present invention relates also
to individual
biomarkers in diagnosing ABI such as mTBI and non-TBI, and ASI, such as mTSI
and non-TSI
in a subject.
The applicants discovered that metabolomic profiling identifies forms of ACNSI
with a
relatively high degree of certainty. As of the date of this invention, the
predictive ability of the
methods of the present invention may be the best biological test to date for
mTBI diagnosis. The
methods and computer programs of the present invention may be used in point-of-
care
metabolomics testing with portable, table/counter top or hand held instruments
that generate
metabolite profiles.
Metabolomic Profiling
Since metabolites exist in a very broad range of concentrations and exhibit
chemical
diversity, there is no one instrument that can reliably measure all of the
metabolites in the non-
human or human metabolome in a single analysis. Instead, practitioners of
metabolomic profiling
generally use a suite of instruments, most often involving different
combinations of liquid
chromatography (LC) or gas chromatography (GC) coupled with MS, to obtain
broad metabolic
coverage [Circulation. 2012; 126: 1110-1120] Although in this invention NMR
and Direct
Injection LC-MS/MS (DI/LC-MS/MS) metabolic profiling were used, it should be
understood
that other instruments such as electrochemical analysis, RI, UV, near-IR, LS,
GC and so forth
may also be used.
NMR and DI-LC-MS/MS metabolic profiles obtained from individuals known to have
a
mTBI and non-mTBI individuals ("controls" or "normals") were analyzed
individually
employing unsupervised dimensionality - reduction techniques; a m __ FBI
predicting classifier was
constructed using supervised machine-learning methods. Specifically: the raw
DI-LC-MS/MS
21
CA 02980376 2017-09-20
WO 2016/149808 PCT/CA2016/050310
and/or NMR data obtained from biological specimens were normalized and
subjected to either or
both Principle Component Analysis (PCA) and t-distributed stochastic nearest
neighbor
embedding (t-SNE). In all cases for PCA, the leading 10 eigenvectors explained
more than 80%
of the variance so the trailing eigenvectors were dropped. The metabolite
loadings in the top 10
eigenvectors were recorded and each subject was projected into PCA space to
inspect
subject - component loadings. Two and three dimensional scatter plots of the
leading 2 (resp. 3)
components revealed strong clustering of mTBI vs. control subjects (FIGs 1 and
4). Based on the
strength of this result, a linear kernel Support Vector Machine (SVM) was
trained to classify
mTBI subjects from an input metabolic profile. A 10 - fold cross validation of
the classifier was
performed which yielded greater than about 80% accuracy on DI-LC-MS/MS raw
data alone,
and between about 90-92% on just DI-LC-MS/MS data alone with reduced number of
metabolites, greater than about 65% accuracy on NMR data alone and about 92%
accuracy on
combined DI-LC-MS/MS and NMR data. Finally a Pearson product moment
coefficient between
the metabolic profiles of each pair of patients was completed to yield a
correlation matrix. Clear
structure was visible in the correlation matrix so complete - linkage
hierarchical clustering was
performed on the matrix which effectively clustered individuals into a 'mTBI'
group, a 'non-
mTBI' group and a small heterogeneous group.
Based on the blood plasma metabolomics profiling (DI-LC-MS/MS and NMR
together,
or DI-LC-M/MS alone), of human patients, mTBI was predicted with approximately
92%
certainty.
Point-of-care testing (e.g. table top MS) could be developed to identify ABI,
including
mTBI and non-TBI patients, and to prognosticate their brain injuries.
As such, in one embodiment, the present invention provides for a method of
diagnosing
or prognosticating a ACNSI in a subject, including acquired brain injury (ABI)
and acquired
spinal cord injuries (A SI). The method may include the following steps: (a)
obtaining a
metabolite profile from the subject; and (b) using multivariate statistical
analysis and machine
learning to compare the subject's profile with a predetermined set of
metabolite profiles of
ACNSI injuries and a predetermined set of metabolite profiles of non-ACNSI
(referred to as
"control" or "normal") to determine or diagnose if the patient has ACNSI
injury or prognosticate
22
CA 02980376 2017-09-20
WO 2016/149808 PCT/CA2016/050310
the ASNSI.
A library of metabolic profiles may be established for diagnosed ABI cases,
including
mTBIs and non-TBIs. For example, a library of metabolic profiles of
concussion, primary blast
in blast-induced traumatic brain injury, electrical-induced brain injury
(electrocution), seizure-
induced brain injury, surgical-induced brain injury, stroke-induced brain
injury, poison-induced
brain injury, psychological brain injury, chemical brain injury, infectious
brain injury, ischemic
brain injury, metabolic brain injury, inflammatory brain injury, autoimmune
brain injury,
degenerative brain injury, hypoxic brain injury, and cancer/radiation-induced
brain injury and
any other possible form of ABI This library may be used as the predetermined
set of metabolic
profiles of ABI. Similarly, libraries may be established for diagnosed ASI
cases to obtain
predetermined set of metabolic profiles of ASI. The predetermined set of
normal metabolic
profiles may be obtained from subjects known not to have a form of ABI and/or
ASI. Using
multivariate statistical analysis and machine learning a comparison may be
made of the subject's
profile with the predetermined set of metabolite profiles of ABI/AS1 and the
predetermined set of
metabolite profiles of non-ABI/non-ASI (referred to as "control" or "normal")
to determine not
only if the patient has ABI/ASI, but also the type of ABI/ASI (i.e.
concussion, primary blast in
blast-induced traumatic brain injury, electrical-induced brain injury
(electrocution), seizure-
induced injury, surgical-induced injury, stroke-induced injury, poison-induced
injury,
psychological injury, chemical injury, infectious injury, ischemic injury,
metabolic injury,
inflammatory injury, autoimmune injury, degenerative injury, hypoxic injury,
and
cancer/radiation-induced injury and so forth) and the prognosis.
The libraries of predetermined profiles (ABI, ASI and controls) may be
provided in a
computer product (memory sticks, as an app for hand held devices such as pads
and cellular
phones and so forth), or they may be uploaded to the memory of a computer
system, including
main frames, desk tops, lab tops, hand held devices such as pads and cellular
phones. Blood or
any other bodily fluid, for example whole blood, blood plasma, blood serum,
saliva, cynovial
fluid, urine, spinal fluid, bronchoalveolar lavage, tears, sweat, extracts and
so forth, may be taken
from a subject suspected of having an ABI and/or ASI. A metabolite profile may
be obtained
from the subject's fluid using any known technology (for example, high
performance liquid
23
CA 02980376 2017-09-20
WO 2016/149808 PCT/CA2016/050310
chromatography, thin layer chromatography, electrochemical analysis, mass
spectroscopy (MS),
refractive index spectroscopy, ultra-violet spectroscopy, fluorescent
analysis, radiochemical
analysis, near-infrared spectroscopy, nuclear magnetic resonance (NMR), light
scattering
analysis, gas chromatography (GC), or GC coupled with MS, direct injection
(DI) coupled with
LC-MS/MS and so forth). The subject's metabolite profile may then be uploaded
to the computer
system (main frames, desk tops, lab tops, hand held devices and so forth). An
operator may then
compare the subject's profile with the predetermined set of metabolite
profiles of ABI and/or
ASI and the predetermined set of metabolite profiles of non-ABI/non-ASI
(referred to as
"control" or "normal") using multivariate statistical analysis and machine
learning to determine
not only if the patient has ABI and/or AS', but also the type of ABI and/or
AS', or whether a
treatment is efficient. The operator may select the type of multivariate
analysis and machine
learning.
Returns to a normal metabolomic profile may serve as an aid in following
medical
interventions (including rehabilitation therapy) of individuals affected by an
ABI, ASI, mTSI,
non-TSI, mTB1 and/or non-TBL and guide return to pre-ABI/pre-ASI play, school,
work and/or
daily activities.
As such, in another embodiment, the present invention is a method of tracking
or
following the efficiency of a medical intervention (including rehabilitation
therapy) in an ACNSI
patient, including mTSI patient, non-TSI patient, mTBI patient and non-TBI
patient, the method
including: (a) obtaining metabolite profiles from the patient at different
times during the medical
intervention (including rehabilitation therapy); and (b) using multivariate
statistical analysis and
machine learning to compare the patient's profiles during or at each of the
different times with a
predetermined set of metabolite profiles of ACNSI and a predetermined set of
metabolite profiles
of non-ACNSI (normal control) to follow the efficiency of the medical
intervention in the
patient. A return to a normal metabolomic profile of the patient may serve to
assess whether the
medical intervention (including rehabilitation therapy) of the patient has
been successful.
In one embodiment, the present invention is a method of assessing a non-human
animal
model of human ACNSI, including mTBI and non-TBI as well as mTSI and non-TSI.
The
method may be used for determining animal models that best represent the human
condition,
24
CA 02980376 2017-09-20
WO 2016/149808 PCT/CA2016/050310
which may be useful for therapeutic intervention and discovery. The method, in
one
embodiment, may include: (a) obtaining a metabolite profile from the non-human
animal model
of ACNSI; and (b) using multivariate statistical analysis and machine learning
to compare the
non-human animal model profile with a predetermined set of metabolite profiles
of human
ACNSI and a predetermined set of metabolite profiles of human non- ACNSI to
determine if the
non-human animal has ACNSI. The non-human animal model may be considered an
accurate,
reliable and reproducible model of human ACNSI if it is classified as ACNSI.
The non-human
animal model may be a model of human ACNSI if it is classified as ACNSI with a
predetermined level of accuracy or certainty.
In order to aid in the understanding and preparation of the within invention,
the following
illustrative, non-limiting, examples are provided.
EXAMPLES
EXAMPLE 1
MATERIALS AND METHODS
The human research ethics board at Western University approved this study.
Informed
consent was obtained from the legal guardians and assent was obtained from
adolescent subjects.
Subject Recruitment:
Male adolescent ice hockey athletes (Bantam Division; aged 12-14 years) from
South
Western Ontario, Canada were recruited to participate in this study. To aid
recruitment, a study
information poster was displayed in City Ice Hockey Arenas, with consent of
Arena officials,
and verbal presentations made to several regional hockey boards and coaches.
Adolescent
hockey athletes that presented to Primary Care Physicians at the Fowler
Kennedy Sports
Medicine Clinic at Western University with a suspected concussion were
screened and
approached for consent. A diagnosis of sport concussion was made when there
was an observed
mechanism of injury followed by onset of typical concussive symptoms, and the
absence of
structural injury. Control subjects were non-injured hockey players that were
age-, sex- and
activity-matched, and that had not suffered a past concussion. Any subject
with a known
neurological insult or disease was excluded. After recruitment, all study
subjects were assigned
CA 02980376 2017-09-20
WO 2016/149808 PCT/CA2016/050310
a random study number for identification. No further subject identifiers were
used in order to
protect identity.
Concussed and control subjects, including their parents/guardians, completed a
Sport
Concussion Assessment Tool-3rd edition [SCAT3; 13-14 years of age; (Guskiewicz
et al.,
2013)] or a Child-SCAT3[(a modified tool recommended for children 12 year of
age or young
that takes into account developmental differences in performance (Glaviano et
al., 2015)]. All
injured athletes underwent a complete history, physical and neurologic
examination by a sports
medicine physician with expertise in concussion management. The injured
athletes were
provided with standardized care for concussion led by a Primary Care Sports
Medicine
physician.
All subjects on the first clinic visit had 20 ml of blood drawn by a certified
phlebotomist,
nurse or physician into EDTA Vacutainer tubes. The blood was centrifuged, and
the plasma
aliquoted and stored at -80 C.
DI-LC/MS/MS
A targeted quantitative metabolomics approach was applied to analyze the
plasma
samples using a combination of direct injection mass spectrometry
(AbsoluteIDQTM Kit) with a
reverse-phase LC/MS/MS Kit (BIOCRATES Life Sciences AG, Austria). This kit, in
combination with an ABI 4000 Q-Trap (Applied Biosystems/MDS Sciex) mass
spectrometer,
can be used for the targeted identification and quantification of up to 180
different endogenous
metabolites including amino acids, acylcarnitines, biogenic amines,
glycerophospholipids,
sphingolipids and sugars. The method combines the derivatization and
extraction of analytes, and
the selective mass-spectrometric detection using multiple reaction monitoring
pairs. Isotope-
labeled internal standards and other internal standards are integrated in the
Kit plate filter for
metabolite quantification. The AbsolutelDQ kit contained a 96 deep-well plate
with a filter plate
attached with sealing tape, and reagents and solvents used to prepare the
plate assay. The first 14
wells in the Kit were used for one blank; three zero samples, seven standards
and three quality
control samples provided with each Kit. All the plasma samples were analyzed
with the
AbsolutelDQ kit protocol, as per the user manual. Briefly, plasma samples were
thawed on ice
and then vortexed and centrifuged at 13,000 x g. Each plasma sample (10 L)
was loaded onto
26
CA 02980376 2017-09-20
WO 2016/149808 PCT/CA2016/050310
the center of the filter on the upper 96-well kit plate and dried in a stream
of nitrogen.
Subsequently, 20 L of a 5% solution of phenyl-isothiocyanate was added for
derivatization.
After incubation, the filter spots were dried again using an evaporator.
Extraction of the
metabolites was then achieved by adding 300 L methanol containing 5 mM
ammonium acetate.
The extracts were obtained by centrifugation into the lower 96-deep well
plate, followed by a
dilution step with kit MS running solvent. Mass spectrometric analysis was
performed on an
API4000 Qtrapil tandem mass spectrometry instrument (Applied Biosystems/MDS
Analytical
Technologies, Foster City, CA) equipped with a solvent delivery system. The
samples were
delivered to the mass spectrometer by LC followed by a DI. The Biocrates MetIQ
software was
used to control the entire assay workflow, from sample registration to
automated calculation of
metabolite concentrations. A targeted profiling scheme was used to
quantitatively screen for
known small molecule metabolites using multiple reaction monitoring, neutral
loss and precursor
ion scans.
NMR
Plasma samples were deproteinized by ultra-filtration as previously described
(Psychogios et aL, 2011). Prior to filtration, 3 KDa cut-off centrifugal
filter units (Amicon
Microcon YM-3) were rinsed five times each with 0.5 mL of H20 and centrifuged
(10,000 rpm
for 10 minutes) to remove residual glycerol bound to the filter membranes.
Aliquots of each
plasma sample were then transferred into the centrifuge filter devices and
centrifuged (10,000
rpm for 20 minutes) to remove macromolecules (primarily protein and
lipoproteins) from the
sample. The filtrates were checked visually for any evidence that the membrane
was
compromised and for these samples the filtration process was repeated with a
different filter and
the filtrate inspected again. The subsequent filtrates were collected and the
volumes were
recorded. If the total volume of the sample was under 600 ut an appropriate
amount from a 50
mM NaH21304 buffer (pH 7.0) was added until the total volume of the sample was
600 L. Any
sample that had to have buffer added to bring the solution volume to 600 4,
was annotated with
the dilution factor and metabolite concentrations were corrected in the
subsequent analysis.
Subsequently, 70 [IL of D20 and 30 L of a standard buffer solution (11.7 mM
DS S (disodium -
2, 2-dimethy1-2-silcepentane-5- sulphonate], 730 mM imidazole, and 0.47% NaN3
in H20) was
27
CA 02980376 2017-09-20
WO 2016/149808 PCT/CA2016/050310
added to the sample.
The plasma sample (700 L) was then transferred to a standard NMR tube for
subsequent
spectral analysis. All 1H-NMR spectra were collected on a 500 MHz Inova
(Varian Inc. Palo
Alto, CA) spectrometer equipped with a 5 mm HCN Z-gradient pulsed-field
gradient room-
temperature probe. 1H-NMR spectra were acquired at 25 C using the first
transient of the
NOESY- pre-saturation pulse sequence, chosen for its high degree of
quantitative accuracy
(Saude et al., 2006). All FID's (free induction decays) were zero- filled to
64 K data points and
subjected to line broadening of 0.5 Hz. The singlet produced by the DSS methyl
groups was
used as an internal standard for chemical shift referencing (set to 0 ppm) and
for quantification
all 'H-NMR spectra were processed and analyzed using the Chenomx NMR Suite
Professional
Software package version 7.1 (Chenomx Inc, Edmonton, AB). The Chenomx NMR
Suite
software allows for qualitative and quantitative analysis of an NMR spectrum
by manually fitting
spectral signatures from an internal database to the spectrum. Specifically,
the spectral fitting for
metabolite was done using the standard Chenomx 500 MHz metabolite library.
Typically 90%
of visible peaks were assigned to a compound and more than 90% of the spectral
area could be
routinely fit using the Chenomx spectral analysis software. Most of the
visible peaks are
annotated with a compound name. It has been previously shown that this fitting
procedure
provides absolute concentration accuracy of 90% or better. Each spectrum was
processed and
analyzed by at least two NMR spectroscopists to minimize compound
misidentification and mis-
quantification. We used sample spiking to confirm the identities of assigned
compounds.
Sample spiking involves the addition of 20-200 IV of the suspected compound
and examination
of the resulting spectra to determine whether the relative NMR signal
intensity changed as
expected.
Data Analyses
Demographic and concussion tool data were reported as mean standard
deviation (SD),
with a P value <0.05 taken as our standard of statistical significance. Raw
NMR and MS data
for each subject were ingested and normalized within each metabolite marker,
across subjects.
More specifically, the data for each metabolic marker were scaled to have unit
norm. Initial
exploratory analysis involved performing Principal Component Analysis (PCA)
directly on the
28
CA 02980376 2017-09-20
WO 2016/149808 PCT/CA2016/050310
subjects by metabolites matrix. Motivated by the observation that the inherent
dimensionality of
the data was significantly lower that the number of metabolite markers,
Nonlinear dimensionality
reduction was performed on the full data matrix using the t-distributed
stochastic nearest
neighbour (t-SNE) embedding algorithm (van der Maaten and Hinton, 2008).
Unlike PCA which
enforces a brittle, orthogonal, linear refactorization of the data, t-SNE
assumes that the 'optimal'
representation of the data lies on a manifold with complex geometry, but low
dimension,
embedded in the full dimensional space of the raw data. t-SNE was used to
reduce the full
metabolic dataset down to only two dimensions. We then trained separate
support vector
machines (SVM), with linear kernels, on the dimensionality reduced and full
datasets to classify
subjects as concussed or non-concussed. We cross-validated our classifier
using a leave-one-out
approach and assessed statistical significance against a null distribution
generated by resampling.
To investigate the robustness of the trained classifier, a Receiver Operating
Characteristic (ROC)
curves were generated; one curve was generated for each fold of a 4-fold cross-
validation
approach where the classifier for each fold is trained on a subset of the data
and then tested on a
disjoint, withheld, subset that was not used for training. The ROC curve plots
the true positive
rate against the false positive rate of the classifier; the top left corner of
the plot is "ideal" and the
main diagonal would be occupied by a classifier that simply guessed randomly
at labels.
RESULTS
Metabolornics
Plasma was assayed from male adolescent ice hockey players: 12 concussed (13.4
1 2.3
years of age) and 17 non-injured controls (12.9 1.0 years of age; P=0.213).
The estimated time
from concussion occurrence to blood draw at the first clinic visit was 2.3
0.7 days.
Self-reported symptom evaluation as per SCAT3 (n=11) revealed a total symptom
score
and a total symptom severity of 11.6 + 4.8 and 29.3 + 22.8, respectively
(Table 1). One
concussed patient was evaluated with the Child SCAT and had a total symptom
score of 6 and a
total symptom severity of 12. All non-injured controls were evaluated with a
SCAT3 (n=17),
which revealed a total symptom score and a total symptom severity of 0.5 + 1.5
and 0.6 1.8,
29
CA 02980376 2017-09-20
WO 2O16/149898 PCIICA2016/050310
respectively.
Plasma was assayed for 143 and 31 metabolites by D1/LC-MS/MS (Table 2) and NMR
(Table 3), respectively.
PCA
Using PCA, the leading 10 components were demonstrated to account for 82% of
the
variance in the data, with each of the 10 components weighted across many of
the underlying
metabolites (Table 4). The most striking observation was the high variance in
plasma
glycerophospholipids between concussed and non-concussed subjects.
t-SNE
The full metabolic dataset was reduced down to two dimensions using t-SNE, as
the
inherent dimensionality of the data was significantly lower than the number of
metabolites (FIG.
1). Following this dimensionality reduction step, a support vector machine
(S'VM) was trained,
with a linear kernel, to classify subjects as concussed or non-concussed.
Cross validation of the
classifier using a leave-one-out approach demonstrated a 92% accuracy rate in
diagnosing a
concussion in adolescent ice hockey players.
Taking classification accuracy as our test statistic, we investigate the
significance of our
observed accuracy via permutation testing. We generated a null distribution by
randomly
shuffling class labels; training and testing a new classifier for each
shuffled label set and
recording the classification rate. Comparing our observed 92% accuracy rate to
a 10,000 sample
null distribution in which none of the null classifiers reached a 92% accuracy
rate, we calculated
a p<0.0001.
We then minimized the number of metabolites required to achieve reasonable
classification accuracy. Using a chi-square test to select informative
metabolites in a univariate
manner, we continued to observe 92% classification accuracy with only 17
metabolites (Table 5,
Column 1). Recursive feature elimination was then used to verify accuracy, and
yielded a
similar classification accuracy of 90% with 31 metabolites (Table 5, Column 2)
As a final step, we clustered concussed and non-concussed subjects by direct
comparison
of their metabolomic profiles. We computed the Pearson product-moment
coefficient for each
CA 02980376 2017-09-20
WO 2016/149808 PCT/CA2016/050310
pair of (normalized) subject metabolic profiles to yield a correlation matrix.
Clusters were
optimally identified in this correlation matrix with agglomerative complete-
linkage hierarchical
clustering (FIG. 2).
A receiver operating curve was generated over a 4-fold cross-validation with a
SVM
(FIG. 3), demonstrating the performance of a binary classifier as its
discrimination threshold is
varied, and yielding a mean ROC of 0.91.
Table 1. Symptom Evaluation via SCAT3 (1 patient not shown as had a child
SCAT)*
Symptom # of Symptoms (n=11) Percent (%)
Headache 10 91%
Dizziness 9 82%
Pressure in head 9 82%
Sensitivity to light 9 82%
Don't feel right 9 82%
Difficulty concentrating 8 73%
Fatigue or low energy 8 73%
Sensitivity to noise 8 73%
Feeling slowed down 8 73%
Drowsiness 7 64%
Balance problems 7 64%
Trouble falling asleep 7 64%
Difficulty remembering 6 55%
Neck Pain 5 45%
Blurred vision 4 36%
Feeling like in a fog 4 36%
Confusion 4 36%
Irritability 3 27%
Nausea or vomiting 2 18%
More emotional 1 9%
31
CA 02980376 2017-09-20
WO 2016/149808 PCT/CA2016/050310
Sadness 1 9%
Nervous or Anxious 1 9%
*1 patient is not shown as they had symptom evaluation via a Child SCAT3
(reported
symptoms: difficulty paying attention; I daydream too much; headache; dizzy;
tired a lot; and
tired easily).
Table 2. DI-LC/MS/MS (143 metabolites)
CO PC aa C32:1 PC ae C30:0 PC ae C42:4 Isoleucine
C14:1 PC aa C32:2 PC ae C30:1 PC ae C42:5 Leucine
C14:2 PC aa C32:3 PC ae C32:1 PC ae C44:3 Lysine
C16 PC aa C34:1 PC ae C32:2 PC ae C44:4 Methionine
C18 PC aa C34:2 PC ae C34:0 PC ae C44:5 Ornithine
C18: I PC aa C34:3 PC ae C34:1 PC ae C44:6 Phenylalanine
C18:2 PC aa C34:4 PC ae C34:2 SM (OH) C14:1 Proline
C2 PC aa C36:0 PC ae C34:3 SM (OH) C16:1 Serine
C3 PC aa C36:1 PC ae C36:0 SM (OH) C22:1 Threonine
C4 PC aa C36:2 PC ae C36:1 SM (OH) C22:2 Tryptophan
C5 PC aa C36:3 PC ae C36:2 SM (OH) C24:1 Tyrosine
C5-0H (C3-DC-M) PC aa C36:4 PC ae C36:3 SM C16:0 Valine
C9 PC aa C36:5 PC ae C36:4 SM C16:1 Acetyl-
Ornithine
lysoPC a C16:0 PC aa C36:6 PC ae C36:5 SM C18:0
Asymmetricdim
ethyl arginine
lysoPC a C16:1 PC aa C38:0 PC ae C38:0 SM C18:1 Total
Dimethylarginin
lysoPC a C17:0 PC aa C38:1 PC ae C38:1 SM C20:2 alpha-
Aminoadipic
lysoPC a C18:0 PC aa C38:3 PC ae C38:2 SM C22:3 Creatinine
32
CA 02980376 2017-09-20
WO 2016/149808
PCT/CA2016/050310
lysoPC a C18:1 PC aa C38:4 PC ae C38:3 SM C24:0 Kynurenine
lysoPC a C18:2 PC aa C38:5 PC ae C38:4 SM C24:1 Methionine-
Sulfoxide
lysoPC a C20:3 PC aa C38:6 PC ae C38:5 SM C26:0 trans-OH-
Proline
lysoPC a C20:4 PC aa C40:2 PC ae C38:6 SM C26:1 Putrescine
lysoPC a C26:0 PC aa C40:3 PC ae C40:1 H1 Spermine
lysoPC a C26:1 PC aa C40:4 PC ae C40:2 Alanine Taurine
lysoPC a C28:0 PC aa C40:5 PC ae C40:3 Arginine
lysoPC a C28:1 PC aa C40:6 PC ae C40:4 Asparagine
PC aa C24:0 PC aa C42:0 PC ae C40:5 Citrulline
PC aa C28:1 PC aa C42:1 PC ae C40:6 Gltamine
PC aa C30:0 PC aa C42:4 PC ae C42:1 Glutamic acid
PC aa C30:2 PC aa C42:5 PC ae C42:2 Glycine
PC aa C32:0 PC aa C42:6 PC ae C42:3 Histidine
Table 3. NMR (31 metabolites)
2-Hydroxybutyrate Propylene glycol
3-Hydroxybutyrate Pyruvate
3-Hydroxyisovalerate Serine
Acetate Succinate
Acetone Threonine
Alanine Tyrosine
Betaine Valine
Carnitine
Citrate
Creatine
Creatinine
Formate
Glucose
33
CA 02980376 2017-09-20
WO 2016/149808 PCT/CA2016/050310
Glutamine
Glycerol
Glycine
Histidine
Isoleucine
Lactate
Leucine
Lysine
Methanol
Phenylalanine
Proline
Table 4: PCA identified the top 10 weighted metabolites for each of the 10
leading
components ("Comp.").
Comp. 0 Comp. 1 Comp. 2 Comp. 3 (Explained Comp. 4 (Explained
(Explained (Explained (Explained variance: 6.1%) variance: 5.76%)
variance: 28.21%) variance: 14.83%) variance:
9.7%)
PC aa C36:0 C5-OH (C3-DC-M) PC aa C36:0 C14:2 (0.183)
lsoleucine (0.158)
(0.171) (0.073) (0.233) C2 (0.181) Leucine (0.155)
PC aa C36:5 lysoPC a C18:2 PC aa C36:5 SM C22:3 (0.243) alpha-
Aminoadipic
(0.185) (0.044) (0.253) Arginine (0.177) acid (0.147)
PC aa C36:6 (0.16) PC aa C36:0 PC aa C38:0 Citrulline (0.13)
Putrescine (0.402)
PC aa C38:0 (0.041) (0.265) Putrescine (0.238)
(0.151) PC aa C36:5 PC aa C38:1 Acetone (0.402) -3-
Hydroxybutyrate
PC aa C38:6 (0.055) (0.221) Carnitine (0.242) (0.202)
(0.165) PC aa C36:6 PC aa C38:6 Glycerol (0.186)
Creatine (0.115)
PC aa C40:6 (0.17) (0.039) (0.249) lsoleucine
(0.15)
PC ae C38:0 PC aa 08:1 PC aa C40:6 Leucine (0.134)
(0.143) (0.046) (0.275) Proline (0.106)
PC ae C38:1 PC ae C38:1 PC aa C42:0
(0.146) (0.039) (0.155)
PC ae C40:6 PC ae C38:2 (0.04) PC ae C38:6
(0.142) Citrulline (0.114) (0.152)
PC ae C40:6
(0.175)
34
CA 02980376 2017-09-20
WO 2016/149808 PCT/CA2016/050310
Table 4 (continued)
Comp. 5 Comp. 6 Corn. 7 Comp. 8 (Explained Comp. 9
(Explained (Explained (Explained variance: 2.63%)
(Explained
variance: 5.61%) variance: variance: variance:
2.46%)
3.84%) 2.97%)
C14:2 (0.152) lysoPC a C3 (0.102) PC aa C40:3 (0.099)
PC ae C36:2
C18:1 (0.173) C26:0 (0.137) C5 (0.157) PC ae C38:1 (0.116)
(0.117)
C18:2 (0.156) lysoPC a PC aa C30:2 PC ae C42:4 (0.11)
PC ae C36:5
C3 (0.169) C26:1 (0.119) (0.184) Asymmetricdimethylarginine (0.108)
C5 (0.212) lysoPC a PC aa C32:2 (0.116) SM (OH)
C14:1
trans-OH-Proline C28:1 (0.109) (0.116) Putrescine (0.372)
(0.136)
(0.228) PC ae C30:1 Proline 3-Hydroxyisovalerate (0.565) SM C26:0
(0.126)
Putrescine (0.244) (0.251) (0.109) Acetone (0.156)
trans-OH-Proline
PC ae C38:1 trans-OH- Carnitine (0.128) (0.418)
3- (0.137) Proline Propylene glycol (0.248)
Hydroxybutyrate Putrescine (0.141) 3-
(0.259) (0.165) Acetone Hydroxyisovalerate
Acetone (0.161) (0.162)
3- (0.336) Carnitine
Hydroxyisovalerate Carnitine (0.267) Methanol
(0.179)
(0.264) (0.179) Proline Propylene glycol
Succinate (0.108) (0.109)
(0.134) Succinate (0.324)
,
CA 02980376 2017-09-20
WO 2016/149808 PCT/CA2016/050310
Table 5. Similar classification accuracy, using two independent analytical
techniques,
achieved with fewer metabolites.
92% accuracy determined with 90% accuracy determined with
a Chi Square test Recursive Feature Elimination
1. 'C5' 1. 'C5'
2. 'PC aa C32:1' 2. 'PC aa C30:2'
3. 'PC aa C32:2' 3. 'PC aa C32:0'
4. 'PC aa C36:5' 4. 'PC aa C32:1'
5. 'PC aa C36:6' 5. 'PC aa C32:2'
6. 'PC ae C34:0' 6. 'PC aa C32:3'
7. 'PC ae C34:3' 7. 'PC aa C34:4'
8. 'PC ae C36:0' 8. 'PC aa C36:6'
9. 'PC ae C36:1' 9. 'PC aa C42:6'
10. 'PC ae C36:2' 10. 'PC ae C30:0'
11. 'PC ae C38:1' 11. 'PC ae C30:1'
12. 'PC ae C38:2' 12. 'PC ae C3211
13. 'PC ae C38:3' 13. 'PC ae C34:0'
14. 'Putrescine' 14. 'PC ae C34:2'
15. 'Formate' 15. 'PC ae C34:3'
16. 'Methanol' 16. 'PC ae C36:0'
17. 'Succinate' 17. 'PC ae C36:2'
18. 'PC ae C38:1'
19. 'PC ae C38:3'
20. 'SM C22:3'
21. 'SM C24:0'
22. 'SM C24:1'
23. 'alpha-Aminoadipic acid'
24. Vans-OH-Proline'
25. 'Putrescine'
36
CA 02980376 2017-09-20
WO 2016/149808 PCT/CA2016/050310
26. 'Betaine'
27. 'Formate'
28. 'Glucose'
29. 'Glycerol'
30. 'Methanol'
31. 'Serine'
In this study, we performed metabolomics profiling on concussed adolescent ice
hockey
players and matched controls. Using multivariate statistical analysis and
machine learning, we
predicted concussed individuals with up to 92% certainty. One of the most
striking patterns
observed was the reliance of the model on changes in plasma
glycerophospholipids, accounting
for approximately 50% of the variance between concussed and non-concussed
subjects.
Metabolomics profiling with machine learning is a novel concussion diagnostic
method with
high sensitivity.
We specifically investigated concussion in adolescent ice hockey players. In
our region,
adolescent males are at the highest risk for concussion, and most frequently
concussed in sport-
related activities at ice hockey arenas (Stewart et al., 2014). Concussions in
these adolescent
patients are of particular concern as their brains are still developing
(Halstead et al., 2010;
Toledo et al., 2012). Younger patients are also more susceptible to injury due
to thinner skulls,
weaker neck muscles, less myelination, greater brain water content, higher
metabolic
requirements and a larger subarachnoid space in which the brain can move more
freely (Karlin,
2011; Morrison et al., 2013). Subsequently, the rates of concussion are higher
in the young and
the time to recovery is prolonged relative to adults (Lovell et al., 2004;
Pellman et al., 2006). In
fact, brain injury may have life-long consequences for adolescents via
interrupted intellectual
and social development (Toledo et al., 2012). Accurate concussion diagnosis is
particularly
important for adolescents, as rapid deployment of appropriate early treatment
and rehabilitation
services could be life-changing for this vulnerable population.
At present, concussion diagnosis is based solely on clinical judgment.
Concussion
patients in our study were diagnosed by a mechanism of injury with typical
concussion
37
CA 02980376 2017-09-20
WO 2016/149808 PCT/CA2016/050310
symptoms. Patients were assessed with either the SCAT3, or the Child-SCAT3 for
one 12 year
old subject, as these are the recommended concussion assessment tools for
these age groups
(Guskiewicz et al., 2013; Glaviano et al., 2015). Based on the average number
of self-reported
symptoms and the symptom severity score, our data suggests mild-moderate
symptom severity
of our concussed male athletes. Moreover, to the best of our knowledge, ours
is the first study to
report normative SCAT3 values for non-injured adolescent male athletes. Self-
reporting of
symptoms is complicated by the subjective nature of the assessment, and
athletes typically
underreport the symptoms (Lovell and Solomon, 2013; Meier et al., 2015).
Concussion diagnostics remains problematic, with clinical judgment as the gold
standard
(McCrory et al., 2013). Thus, there has been an active search for a diagnostic
blood biomarker
(eg. GFAP, Tau, NFL). Despite a large body of research, no single biomarker or
biomarker panel
has been identified for widespread diagnostics, likely due to inadequate
sensitivity, specificity or
reproducibility (Jeter et al., 2013). A single biomarker or a small number of
biomarkers may not
accurately reflect the patient and injury heterogeneity that occurs in brain
trauma. Additional
concerns relate to individual biomarkers being compared to variable
definitions of concussion, to
inconsistent use of common clinical and biomarker-related data elements, to
the variable timing
of outcome measures and to lack of understanding of individual temporal
profiles (Papa et al.,
2015). Our metabolomics profiling, with 174 metabolites examined and as few as
17 metabolites
required for classification accuracy, may be useful for developing future
point-of-care testing
and a decision-support system for future concussion diagnostics (i.e. interne
interface).
Conventional statistics are model-driven in that they are based on the
assumption that
there are a relatively small number of important variables and that careful
variable selection is
the key to good model performance. This approach has provided important
clinical information
on populations, but is significantly limited for understanding disease in
individuals. A
supplement to conventional statistics is machine learning, that lets the data
create the model by
detecting underlying patterns (Shouval et al., 2014). Metabolomics is ideally
suited for machine
learning techniques, as the final performance of the model relies on how much
information each
dataset contains.
Metabolomics profiling requires analyses of all detected metabolites
simultaneously, with
38
CA 02980376 2017-09-20
WO 2016/149808 PCT/CA2016/050310
PCA analysis techniques used most commonly (Bujak et al., 2014). Unlike PCA
which enforces
a brittle, orthogonal, linear refactorization of the data, t-SNE assumes that
the 'optimal'
representation of the data lies on a manifold with complex geometry, but low
dimension,
embedded in the full dimensional space of the raw data (van der Maaten and
Hinton, 2008). The
power of the t-SNE dimensionality reduction step was seen once individual
subjects were plotted
in the reduced 2-dimensional space.
Using the aforementioned analytics, we determined that the variance in
metabolites
between concussed and non-concussed subjects was most pronounced for the
glycerophospholipids. Glycerophospholipids are dynamic molecules, which turn
over at
different rates depending on their structure, composition and localization in
cellular membranes.
With respect to the brain, glycerophospholipids account for ¨25% of dry weight
and are heavily
concentrated in myelin (Farooqui et al., 2000). Glycerophospholipids regulate
membrane
fluidity and permeability, and they are a reserve for a variety of second
messengers. Degradation
of glycerophospholipids occurs via phospholipases.
Once the number of metabolites was reduced, but still maintained high
classification
accuracy, the most informative were choline glycerophospholipids with a number
of choline
plasmalogens (e.g., PCaeC34:0, PCaeC34:3, PCaeC36:0, PCaeC36:1, PCaeC36:2,
PCaeC38:1,
PCaeC38:2 and PCaeC38:3). Plasmalogens are present in significant amounts in
myelin, with
>70% of myelin glycerophospholipids being plasmalogens (Braverman and Moser,
2012).
Plasmalogens are considered to have several functions including contributing
to membrane
structure, acting as membrane antioxidants and being a source of second
messenger molecules.
The acylcarnitine C5 also had a prominent role in classification accuracy. The
role of C5
is complex and related to energy metabolism, fatty acid transport and
mitochondrial fatty acid
oxidation, ketosis, oxidative stress and mitochondrial membrane damage. C5 is
produced during
the catabolism of the branched chain amino acids leucine and isoleucine. An
elevation of C5
acylcarnitine may be an indicator of block at the levels of isovaleryl-CoA
dehydrogenase and
short/branched chain acyl-CoA dehydrogenase. Other metabolites of importance
for accurate
classification include putrecine, methanol, formate and succinate. When taken
these latter
metabolites are taken together, the findings suggest acute changes in brain
energy metabolism
39
CA 02980376 2017-09-20
WO 2016/149808 PCT/CA2016/050310
after concussion in these young athletes (Sikoglu et al., 2015).
Most of the informative metabolites, such as the glycerophospholipids, gather
into
metabolite groups. Nonetheless, it is difficult to develop a unifying theory.
The metabolites
identified may reflect secondary consequences to the primary concussive injury
or themselves
may have common secondary metabolic impacts. Further experimentation using
animal models
of TBI may be informative where both brain and plasma can be analyzed in
parallel.
Normalization of metabolites could reflect tissue healing and recovery, and
help guide
concussion rehabilitation and safe return to play and other daily activities.
Providing an
objective measure of recovery through metabolomics has great potential to
enhance concussion
= management by further standardizing return-to-play and return-to-learn
practices beyond what
legislation and policies can currently provide. This can protect athletes from
returning to
activities too early which can lead to increased risk of repeat concussions,
other injury and the
prolongation of symptoms. (Harmon et al, 2013) Finally, clinical judgment is
the de facto 'gold
standard' for concussion diagnosis and thus concussion may have been over-
diagnosed in the
"concussed group". Also, previous concussions may have been missed in the
"control" group,
while sub-clinical brain injuries would not have been accurately represented.
In summary, using plasma metabolomi cs profiling, together with multivariate
statistical
analysis and machine learning, we identified concussed individuals with 92%
certainty. Of the
two analytic techniques used, NMR and DI-LC/MS/MS, the metabolites measured
with tandem
MS appear to offer greater predictive ability. Indeed, much of the observed
variance between
groups was due to changes in plasma glycerophospholipids and C5. Metabolomics
profiling
represents a novel diagnostic method for mTBI, and may be amenable to point-of-
care
metabolomic testing.
References for Example 1
Braverman NE, Moser AB. Functions of plasmalogen lipids in health and disease
Biochim Biophys Acta 2012; 1822(9): 1442-52.
Bujak R, Struck-Lewicka W, Markuszewski MJ, Kaliszan R. Metabolomics for
laboratory diagnostics. Journal of pharmaceutical and biomedical analysis
2014.
CA 02980376 2017-09-20
WO 2016/149808 PCT/CA2016/050310
Farooqui AA, Horrocks LA, Farooqui T. Glycerophospholipids in brain: their
metabolism, incorporation into membranes, functions, and involvement in
neurological
disorders. Chemistry and physics of lipids 2000; 106(1): 1-29.
Glaviano NR, Benson S, Goodkin HP, Broshek DK, Saliba S. Baseline SCAT2
Assessment of Healthy Youth Student-Athletes: Preliminary Evidence for the Use
of the Child-
SCAT3 in Children Younger Than 13 Years. Clin J Sport Med 2015; 25(4): 373-9.
Guskiewicz KM, Register-Mihalik J, McCrory P, McCrea M, Johnston K, Makdissi
M, et
al. Evidence-based approach to revising the SCAT2: introducing the SCAT3. Br J
Sports Med
2013; 47(5): 289-93.
Harmon KG, Drezner JA, Gammons M, Guskiewicz KM, Halstead M, Herring SA,
Kutcher JS, Pana A, Putakian M, Roberts WO. American Medical Society of Sports
Medicine
position statement: Concussion in sport. British Journal of Sports Medicine.
2013;47(1):15-26.
Halstead ME, Walter KD, Council on Sports M, Fitness. American Academy of
Pediatrics. Clinical report--sport-related concussion in children and
adolescents. Pediatrics 2010;
126(3): 597-615.
http ://www.cdc.gov/TraumaticBrainInjury.
Jeter CB, Hergenroeder GW, Hylin MJ, Redell JB, Moore AN, Dash PK. Biomarkers
for
the diagnosis and prognosis of mild traumatic brain injury/concussion. Journal
of neurotrauma
2013; 30(8): 657-70.
Karlin AM. Concussion in the pediatric and adolescent population: "different
population,
different concerns". PM R 2011; 3(10 Suppl 2): S369-79.
Lovell MR, Collins MW, Iverson GL, Johnston KM, Bradley JP. Grade 1 or "ding"
concussions in high school athletes. Am J Sports Med 2004; 32(1): 47-54.
Lovell MR, Solomon GS. Neurocognitive test performance and symptom reporting
in
cheerleaders with concussions. J Pediatr 2013; 163(4): 1192-5 el.
McCrory P, Meeuwisse W, Aubry M, Cantu B, Dvorak J, Echemendia RJ, et al.
Consensus statement on concussion in sport--the 4th International Conference
on Concussion in
41
CA 02980376 2017-09-20
WO 2016/149808 PCT/CA2016/050310
Sport held in Zurich, November 2012. Clin J Sport Med 2013; 23(2): 89-117.
Meier TB, Brummel BJ, Singh R, Nerio CJ, Polanski DW, Bellgowan PS. The
underreporting of self-reported symptoms following sports-related concussion.
J Sci Med Sport
2015; 18(5): 507-11.
Morrison G, Fraser DD, Cepinskas G. Mechanisms and consequences of acquired
brain
injury during development. Pathophysiology 2013; 20(1): 49-57.
Papa L, Ramia MM, Edwards D, Johnson BD, Slobounov SM. Systematic review of
clinical studies examining biomarkers of brain injury in athletes after sports-
related concussion.
Journal of neurotrauma 2015; 32(10): 661-73.
Pellman EJ, Lovell MR, Viano DC, Casson IR. Concussion in professional
football:
recovery of NFL and high school athletes assessed by computerized
neuropsychological testing--
Part 12. Neurosurgery 2006; 58(2): 263-74; discussion -74.
Shouval R, Bondi 0, Mishan H, Shimoni A, Unger R, Nagler A. Application of
machine
learning algorithms for clinical predictive modeling: a data-mining approach
in SCT. Bone
marrow transplantation 2014; 49(3): 312-7.
Sikoglu EM, Liso Navarro AA, Czerniak SM, McCafferty J, Eisenstock J,
Stevenson .TH,
et al. Effects of Recent Concussion on Brain Bioenergetics: A Phosphorus-31
Magnetic
Resonance Spectroscopy Study. Cogn Behav Neurol 2015; 28(4): 181-7.
Stewart TC, Gilliland J, Fraser DD. An epidemiologic profile of pediatric
concussions:
identifying urban and rural differences. The journal of trauma and acute care
surgery 2014;
76(3): 736-42.
Toledo E, Lebel A, Becerra L, Minster A, Linnman C, Maleki N, et al. The young
brain
and concussion: imaging as a biomarker for diagnosis and prognosis. Neurosci
Biobehav Rev
2012; 36(6): 1510-31.
van der Maaten L, Hinton G. Visualizing data using t-SNE. J Mach Learn Res
2008;
9(11): 2579-605.
EXAMPLE 2¨ Primary Blast Traumatic Brain Injury
42
CA 02980376 2017-09-20
WO 2016/149808 PCT/CA2016/050310
MATERIALS AND METHODS
Blast Exposure
In conducting this research the authors adhered to the "Guide to the Care and
Use of
Experimental Animals" and "The Ethics of Animal Experimentation" published by
the Canadian
Council on Animal Care. Adult male Sprague-Dawley rats were acquired from
Charles River
Laboratories (St Constant, Que, Canada) and acclimated for at least one week
prior to exposure.
There are 15 control and 15 blast samples. On the day of use, the animals (-
280-330 g) were
anaesthetized with 3% isoflurane in oxygen and placed into a restraint
consisting of a clear
plastic cylindrical sleeve, with the neck encircled snugly in a plastic collar
and the head
protruding through an opening in the end, which is concaved such that it
matches the curvature
of the blast tube interior. The hind quarters were supported using an end cap
fitted with a piston.
To the left of the head and contralateral to the shock wave direction, a mesh
netting was secured
between two pins placed vertically in line with the side of, and above and
below the head. The
motion of the head was restrained using two different methods defined as Head
Restraint 1 and
2. With Head Restraint 1, the head was placed against the vertical netting,
and then held in place
using additional netting around the head. Head Restraint 2 also used the
vertical mesh, but with
the head of the anaesthetized animal supported using a thin strip of duct tape
placed horizontally
between the bottom pins. Importantly, this method did not secure the head in
place against the
vertical mesh with additional netting. After a total of eight min of
anaesthesia, the restraint
containing the animal was set into the wall of the Advanced Blast Simulator
(ABS) 4280 mm
downstream from the diaphragm, such that only the head protruded into the test
section. Test
groups consisted of sham control, while the experimental group consisted of
head-only, side-on
exposures of single pulse shock wave static overpressures of 30 psi of ¨6-7
msec positive
duration.
Advanced Blast Simulator (ABS)
A custom - built ABS (-30.5 cm in diameter and 5.79 m in length) was used for
producing simulated blast waves. Unlike a conventional shock tube, the ABS was
designed from
first principles to replicate the wave dynamics of explosive blast by means of
its specially shaped
divergent area. It is particularly important to reproduce the correct tailored
waveforms for static
43
CA 02980376 2017-09-20
WO 2016/149808 PCT/CA2016/050310
and dynamic pressure in the shockwave which are most often misrepresented in
conventional
shock tubes. The ABS consists of a "driver" section filled with high-pressure
gas separated by a
frangible diaphragm from a transition section, leading to an ambient-pressure
test section.
Controlled pressurization of the driver causes rupture of the diaphragm at
predetermined
pressures, abruptly releasing the high-pressure gas and driving a tailored
shock wave down the
length of the test section. The inclusion of an End Wave Eliminator (EWE) at
the end of the test
section precludes reflected waves propagating back into the testing area; the
EWE also mitigates
noise and gas efflux into the laboratory space. By means of these unique
design features, the
ABS generates highly reproducible single-pulse shock waves tailored to
replicate those of
explosive blast. The required target pressure and waveform shapes were
achieved using
compressed helium in the driver and various layering and thicknesses of
reinforced cellulose
acetate sheets for the frangible diaphragm.
ABS Pressure Data Acquisition
Static pressures were measured using PCB 113A28 gauges placed at 2780, 3280,
3780,
4280 and 4780 mm from the diaphragm. Total pressures experienced by the test
animal were
measured using a Pitot probe (Endevco 8530B pressure transducer) orientated
such that it
measured the total pressures at the test location 4280 mm from the diaphragm.
Dynamic
pressures were obtained by calculating the difference between the static and
total pressure
recorded at this location. All pressure data was recorded using a custom
Labview interface and
recorded on a GaGe Octopus 8389 CompuScope PCIe digitizer board at a sampling
rate of
500,000 samples/sec.
Metabolomics
The rats were humanely sacrificed and the circulating blood volume removed by
intracardiac stab. The blood was immediately transferred from the syringe to
EDTA containing
tubes and centrifuged. The upper plasma layer was removed, aliquoted and
stored at -80 C until
assayed.
DJ-LC-MS/MS
A targeted quantitative metabolomics approach was applied to analyze the
plasma
samples using a combination of direct injection mass spectrometry
(Absolute1DQTM Kit) with a
44
CA 02980376 2017-09-20
WO 2016/149808 PCT/CA2016/050310
reverse-phase LC-MS/MS Kit (BIOCRATES Life Sciences AG, Austria) This kit, in
combination with an AIM 4000 Q-Trap (Applied Biosystems/MDS Sciex) mass
spectrometer,
can be used for the targeted identification and quantification of up to 180
different endogenous
metabolites including amino acids, acylcarnitines, biogenic amines,
glycerophospholipids,
sphingolipids and sugars. The method used combines the derivatization and
extraction of
analytes, and the selective mass-spectrometric detection using multiple
reaction monitoring
(MRM) pairs. Isotope-labeled internal standards and other internal standards
are integrated in Kit
plate filter for metabolite quantification. The AbsoluteIDQ kit contained a 96
deep-well plate
with a filter plate attached with sealing tape, and reagents and solvents used
to prepare the plate
assay. First 14 wells in the Kit were used for one blank; three zero samples,
seven standards and
three quality control samples provided with each Kit. All the plasma samples
were analyzed with
the AbsolutelDQ kit protocol, as per the user manual. Briefly, plasma samples
were thawed on
ice and then vortexed and centrifuged at 13,000x g. Ten p1 of each plasma
sample was loaded
onto the center of the filter on the upper 96-well kit plate and dried in a
stream of nitrogen.
Subsequently, 20 p.L of a 5% solution of phenyl-isothiocyanate was added for
derivatization.
After incubation, the filter spots were dried again using an evaporator.
Extraction of the
metabolites was then achieved by adding 300 1.t1_, methanol containing 5 mM
ammonium acetate.
The extracts were obtained by centrifugation into the lower 96-deep well
plate, followed by a
dilution step with kit MS running solvent. Mass spectrometric analysis was
performed on an
API4000 Qtrap tandem mass spectrometry instrument (Applied Biosystems/MDS
Analytical
Technologies, Foster City, CA) equipped with a solvent delivery system. The
samples were
delivered to the mass spectrometer by LC followed by a DI. The Biocrates MetIQ
software was
used to control the entire assay workflow, from sample registration to
automated calculation of
metabolite concentrations to the export of data into other data analysis
programs. A targeted
profiling scheme was used to quantitatively screen for known small molecule
metabolites using
multiple reaction monitoring, neutral loss and precursor ion scans.
Data Analyses
Raw DI-LC-MS/MS data for each animal were ingested and normalized within each
metabolite marker, across subjects (specifically: the data for each metabolic
marker were scaled
CA 02980376 2017-09-20
WO 2016/149808 PCT/CA2016/050310
to have unit norm). Initial exploratory analysis involved performing Principal
Component
Analysis (PCA) directly on the animals x metabolites matrix.
The full metabolic raw dataset was also reduced down to two dimensions using t-
SNE, as the
inherent dimensionality of the data was significantly lower that the number of
metabolites.
Following this dimensionality reduction step, a SVM was trained, with a linear
kernel, to classify
subjects as concussed or non-concussed.
Results
PCA Analysis
FIG. 4 is a PCA plot of the first 3 components. All the controls cluster in a
relatively
tight group to the right side, except for a few controls that clustered with
the blast animals. The
classifier is 83% accurate telling Blast from Control. Table 6 shows the top 8
weighted
metabolites for each of the 10 leading components.
Dimensionality Reduction
The full metabolic dataset was reduced down to two dimensions using t-SNE, as
the
inherent dimensionality of the data was significantly lower that the number of
metabolites (see
FIG. 5). Following this dimensionality reduction step, a SVM was trained, with
a linear kernel,
to classify the rats as blast or control. Cross validation of our classifier
using a leave-one-out
approach demonstrated up to 86% (range 80-86%) accuracy rate in identifying a
primary blast
from a control rat (11-fold cross validated).
FIG. 6 is a Pearson product-moment coefficient to pairwise compare metabolite
profiles
between subjects.
FIG. 7 illustrates a hierarchical clustering on the distance matrix of FIG. 6.
The
hierarchical clustering of FIG. 6 shows a big cluster on the left which are
all controls (C). Bigger
cluster on the right is mostly blast (B), but also a few controls. In FIGs. 6
and 7 labels 0-15 are
blast rats, 16-31 are control rats.
Taking classification accuracy as our test statistic, we investigate the
significance of our
observed accuracy via permutation testing. We generated a null distribution by
randomly
46
CA 02980376 2017-09-20
WO 2016/149808 PCT/CA2016/050310
shuffling class labels; training, and testing, a new classifier for each
shuffled label set; and
recording the classification rate. Generating 1000 null distributions with a
permutation approach
yields a p<0.0001 for the 80% (conservative) classification rate.
Table 6: PCA
Comp.'. 0 (Explained Comp. 1 (Explained Comp. 2 (Explained
Comp. 3 (Explained
variance: 80.31%) variance: 4.5%) variance: 4.05%)
variance: 2.13%)
PC ae C36:4 (0.103) Asparagine (0.185) C16 (0.253) C18:2
(0.091)
PC ae C38:2 (0.103) Aspartic acid (0.199) C18 (0.244) C2
(0.14)
PC ae C38:4 (0.103) Ornithine (0.177) C18:1 (0.252) C4
(0.111)
PC ae C40:2 (0.103) Carnosine (0.248) C18:2 (0.229) C5
(0.122)
PC ae C40:5 (0.103) Histamine (0.33) PC aa C30:2 (0.191)
C5:1 (0.13)
SM (OH) C14:1 (0.103) Methionine sulfoxide (0.189) SM C18:0 (0.183)
Dimethylarginine
SM (OH) C22:1 (0.103) Serotonin (0.183) SM C18:1 (0.14) (0.144)
SM (OH) C22:2 (0.103) Taurine (0.177) SM C22:3 (0.207) cis-OH-
Proline (0.384)
Serotonin (0.107)
Comp. 4 (Explained Comp. 5 (Explained Comp. 6 (Explained
Comp. 7 (Explained
variance: 1.52%) variance: 1.31%) variance: 0.87%) variance: 0.81%)
C4 (0.108) lysoPC a C28:0 (0.087) CO (0.128) IysoPC a
C28:1 (0.171)
PC aa C32:1 (0.072) PC aa C30:2 (0.676) C4 (0.119) PC aa
90:2 (0.202)
PC ae C30:1 (0.096) PC aa C38:1 (0.085) PC ae C30:1 (0.197)
PC aa 92:1 (0.112)
SM C16:0 (0.074) PC aa C42:0 (0.095) PC ae C38:1 (0.151) PC
aa C32:2 (0.136)
SM C22:3 (0.354) PC ae C30:1 (0.124) Carnosine (0.158) PC aa
94:4 (0.124)
Alanine (0.088) Creatinine (0.117) Histamine (0.19)
Carnosine (0.119)
Histamine (0.084) cis-OH-Proline (0.309) cis-OH-Proline
Serotonin (0.49)
cis-OH-Proline (0.279) Spermidine (0.158) (0.547) Taurine (0.112)
Serotonin (0.466)
Comp. 8 (Explained Comp. 9 (Explained
variance: 0.65%) variance: 0.54%)
PC aa C30:0 (0.156) C5 (0.174)
PC aa C32:0 (0.245) lysoPC a C20:4 (0.155)
47
CA 02980376 2017-09-20
WO 2016/149808 PCT/CA2016/050310
PC aa C32:1 (0.114) lysoPC a C28:1 (0.114)
PC aa C38:1 (0.134) PC aa C30:0 (0.172)
PC ae C34:0 (0.214) PC aa C32:0 (0.281)
PC ae C34:1 (0.126) PC ae C34:0 (0.19)
PC ae C36:4 (0.131) Histamine (0.202)
cis-OH-Proline (0.27) Spermidine (0.116)
1. "Corn." = Component
Example 3 - Prognosis
Metabolomics
Plasma was assayed from three groups of participants: (1) participants having
a first
concussion episode, (2) participants with two or more reported concussions,
and (3) control
participants with no history of concussion. All concussed and non-concussed
controls were
clinically evaluated to determine concussion symptoms and severity. The
participants were also
assessed according to accepted standard diagnostic criteria. Plasma was
assayed for metabolites
by DI/LC-MS/MS and NMR.
PCA
Using PCA, the leading 10 components were demonstrated to account for the
majority of
the variance in the data, with each of the 10 components weighted across many
of the underlying
metabolites.
t-SNE
The full metabolic dataset was reduced down to two dimensions using t-SNE, as
the
inherent dimensionality of the data was significantly lower than the number of
metabolites.
Following this dimensionality reduction step, a support vector machine (SVM)
was trained, with
a linear kernel, to classify subjects as concussed or non-concussed. Cross
validation of the
classifier using a leave-one-out approach demonstrated a high percentage of
accuracy rate in
diagnosing a first concussion vs. multiple concussions.
48
CA 02980376 2017-09-20
WO 2016/149808 PCT/CA2016/050310
Taking classification accuracy as our test statistic, the significance of the
accuracy may
be tested via permutation testing. A null distribution may be generated by
randomly shuffling
class labels; training and testing a new classifier for each shuffled label
set and recording the
classification rate.
The number of metabolites required to achieve reasonable classification
accuracy may be
minimized using a chi-square test to select informative metabolites in a
univariate manner, and
observe the percentage in classification accuracy with a minimized set of
metabolites.
As a final step, the three different groups may be clustered by direct
comparison of their
metabolomics, including lipidome, profiles. Pearson product-moment coefficient
may be
computed for each pair of (normalized) subject metabolic profiles to yield a
correlation matrix.
Clusters may be optimally identified in this correlation matrix with
agglomerative complete-
linkage hierarchical clustering.
A receiver operating curve may be generated over a 4-fold cross-validation
with a SVM,
to demonstrate the performance of a binary classifier as its discrimination
threshold is varied.
Example 4 - Differentiating types of ACNSI
Metabolornics
Plasma was assayed from six groups of participants: (1) mTBI participants
having a
concussion (concussion group), (2) mTBI participants having primary blast in
blast-induced
traumatic brain injury (blast group), (3) non-TBI participants with
psychological distress (e.g.
PTSD) brain injury (psychological group), (4) mTSI participants having spinal
cord contusion
(contusion group), (5) non-TSI participants (non-TSI group) and (6) control
participants with no
history of brain/spinal injury. The participants were assessed according to
accepted standard
diagnostic criteria.
Plasma was assayed for metabolites by DI/LC-MS/MS and NMR.
PCA
Using PCA, the leading 10 components were demonstrated to account for the
majority of
the variance in the data, with each of the 10 components weighted across many
of the underlying
49
metabolites.
t-SNE
The full metabolic dataset was reduced down to two dimensions using t-SNE, as
the
inherent dimensionality of the data was significantly lower than the number of
metabolites.
Following this dimensionality reduction step, a support vector machine (SVM)
was trained, with
a linear kernel, to classify subjects as concussed or non-concussed. Cross
validation of the
classifier using a leave-one-out approach demonstrated a high percentage of
accuracy rate in
diagnosing spinal injury, concussion, blast and psychological brain injuries.
Taking classification accuracy as our test statistic, the significance of the
accuracy may
be tested via permutation testing. A null distribution may be generated by
randomly shuffling
class labels; training and testing a new classifier for each shuffled label
set and recording the
classification rate.
The number of metabolites required to achieve reasonable classification
accuracy may be
minimized using a chi-square test to select informative metabolites in a
univariate manner, and
observe the percentage in classification accuracy with a minimized set of
metabolites.
As a final step, the four different groups may be clustered by direct
comparison of their
metabolomics, including lipidome, profiles. Pearson product-moment coefficient
may be
computed for each pair of (normalized) subject metabolic profiles to yield a
correlation matrix.
Clusters may be optimally identified in this correlation matrix with
agglomerative complete-
linkage hierarchical clustering.
A receiver operating curve may be generated over a 4-fold cross-validation
with a SVM,
to demonstrate the performance of a binary classifier as its discrimination
threshold is varied.
Through the embodiments that are illustrated and described, the currently
contemplated
best mode of making and using the invention is described. Without further
elaboration, it is
believed that one of ordinary skill in the art can, based on the description
presented herein, utilize
the present invention to the full extent.
Although the description above contains many specificities, these should not
be construed
Date Recue/Date Received 2021-02-02
CA 02980376 2017-09-20
WO 2(116/149898 PCT/CA2016/050310
as limiting the scope of the invention, but as merely providing illustrations
of some of the
presently embodiments of this invention.
51