Note: Descriptions are shown in the official language in which they were submitted.
CA 02764092 2012-01-17
SPOT WELD DATA MANAGEMENT AND MONITORING SYSTEM
BACKGROUND
[0001] On automotive assembly lines,. much of the assembly process involves
welding operations performed by robotic welders. Welding is a critical process
that
impacts many parts of the automobile, including the performance of the parts
in the
completed vehicle. The quality of the each weld not only has an impact on
consumer
concerns such as alignment of the body parts, ride and noise, and longevity of
the
vehicle, but also has a direct impact on manufacturing cycle time, scrap,
downtime,
and overall costs. In a worst-case scenario, a batch of bad welds may require
a
manufacturer vehicle recall.
[0002] Robotic welding systems are subject to various problems that impact
the quality of the weld. System parts wear out over time and in other cases,
may be
damaged or simply fail for a.variety of reasons. As welding tips and other
parts of
the robotic system wear or fail, the integrity of the weld begins to diminish.
To
maintain the integrity and quality of the weld, most robotic welding systems
have a
variety of monitoring sensors that measure one or more elements of
each'welding
operation. Data from the sensors may be collected and analyzed using a
software-
based monitoring and control system that provides details about the quality of
each
weld and the performance of the equipment. The monitoring and control system
may
further provide warnings about possible problems or failures and in some
instances,
provide feedback to control the equipment. An automotive manufacturer may also
rely on periodic inspections and testing of welds to confirm the welding
equipment is
STL-SWMICDA - 1
CA 02764092 2012-01-17
functioning properly. As problems are detected, robotic parts may be adjusted
or
replaced as needed.
[0003] Weld monitoring and control systems collect a .substantial amount of
data but do not always provide a convenient means for analyzing and evaluating
the
data that is collected. Monitoring and control systems may issue warnings or
alarms
when the equipment malfunctions or a specific weld parameter falls outside a
specified tolerance but they do not assist the manufacturer in detecting
trends,
including failure trends. Furthermore, when a welding problem is detected,
monitoring systems do not provide any features or functionality to assist the
manufacturer in determining the scope of the problem and in identifying other
parts
that may have been impacted by the problem. There is a need for a weld data
management and monitoring system that facilitates review and analysis of weld
data
trends over a period of time. There is a need for a weld data management and
monitoring system that assists a manufacturer in identifying the scope and
timing of
weld problems and failures. Finally, there is a need for a weld data
management
and monitoring system that assists a manufacturer in isolating parts may have
been
impacted by a welding equipment or process problem.
SUMMARY
[0004] The present disclosure describes a weld data management and
monitoring system that supports weld data trend analysis. Weld data is
collected for
each weld operation and a trend index equation is applied to the weld data to
calculate a composite number for the operation. The composite numbers for
numerous welds may be plotted. or graphed and analyzed to detect and evaluate
weld trends over a specified period of time. In an example embodiment, the
trend
STL-SWWCDA -2-
CA 02764092 2012-01-17
index equation uses the weld heat input, current, resistance, and time values
to
calculate the composite number.
[0005] The trend index equation facilitates the identification of variances in
weld operations that may be meaningful. Composite numbers that exceed an upper
or lower tolerance limit may cause an alert or alarm to be issued. Trend data
within
specified tolerances may be analyzed to identify a time when variances,
whether
within or outside specified tolerances, occurred. The ability to detect and
analyze
variances in weld operation data during a specified period of time may assist
the
manufacturer in identifying and resolving not only problems. related to the
weld
equipment but also other manufacturing processes or operations that may have
caused variances in weld operations.
[0006] In accordance with one embodiment, there is provided a computerized
spot weld data management system comprising: (a) a database storing spot weld
point data for a plurality of weld operations, said weld point data
comprising: (1) a
current value; (2) a resistance value; and (3) a time for said point data; (b)
a
computer with programming instructions that: (1) for each of said plurality of
weld
operations: (i) retrieves from said database said weld point data; (ii)
calculates a
trend index value for said weld operation; and (2) generates a display
comprising a
plot of trend index values for a period of time.
[0007] In accordance with another embodiment, there is provided a
computerized spot weld data management method comprising: (a) storing in a
database spot weld point data for a plurality of weld operations, said weld
point data
comprising: (1) a current value; (2) a resistance value; and (3) a time for
said point
data; (b) receiving at a computer from said database said weld point data for
each of
said plurality of weld operations; (c) calculating at said computer a trend
index value
STL-SWMICDA -3-
CA 02764092 2012-01-17
for each of said plurality of weld operations; and (d) generating at said
computer a
display comprising a plot of trend index values for a period of time.
[0008] In accordance with another embodiment of the invention, there is
provided a computerized method for displaying spot weld data comprising: (a)
configuring a database to store spot weld point data for a plurality of weld
operations,
said weld point data comprising: (1) a current value; (2) a resistance value;
and (3) a
time for said point data; (b) receiving at a computer from said database weld
point
data for each of a plurality of baseline weld operations; (c) calculating at
said
computer a baseline trend index value for each of said plurality of baseline
weld
operations; (d) receiving at said computer from said database weld point data
for
each of a plurality of test weld operations; (e) calculating at said computer
a test
trend index value for each of said plurality of test weld operations; and (f)
generating
at said computer a display comprising a plot of said baseline trend index
values and
said test trend index values.
BRIEF DESCRIPTION OF THE DRAWINGS
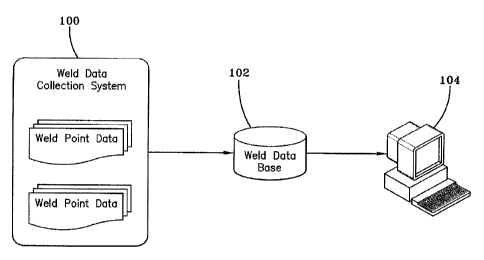
[0009] Figure 1 is a block diagram of primary components for a spot weld data
management and monitoring system according to an example embodiment;
[0010] Figure 2 is a trend index equation illustration according to an example
embodiment;
[0011] Figures 3A and 3B are sample trend index plot or graph screens
according to an example embodiment;
[0012] Figure 4 is a sample weld resistance data screen according to an
example embodiment;
STL-SWM/CDA -4-
CA 02764092 2012-01-17
[0013] Figure 5 is a sample trend index analysis screen according to an
example embodiment;
[0014] Figures 6A and 6B are sample trend index graphs according to an
example embodiment;
[0015] Figures 7A-71 are sample tip dress and secondary circuit analysis
screens according to an example embodiment;
[0016] Figures 8A and 8B are sample secondary circuit analysis screens
according to an example embodiment;
[0017] Figures 9A-9B, 10A-10B, 11 A-11 D, and 12A-12D are sample graphs
for analyzing tolerances based on weld types according to an example
embodiment.
DETAILED DESCRIPTION
[0018] Referring to Figure 1, a block diagram of a weld data management and
monitoring system according to an example embodiment is shown. Weld point data
from one or more spot welding robots on an assembly line is collected at a
weld data
collection system 100. The weld point data is stored in a weld database 102
for use
in a computerized weld data management and monitoring tool 104, In an example
embodiment, the weld data management and monitoring system comprises a server
or computer 104 executing a software application or tool that calculates the
trend
index value for each weld operation of each robot and provides features and
functionality for viewing and analyzing the trend data. The weld database 102
may,
be accessible through multiple networked computers and the tool may be
implemented in a variety of ways so that it is accessible to numerous computer
users. For example, the tool may be implemented as a web-based application
accessible from a web server.
STL-SWM/CDA -6-
CA 02764092 2012-01-17
[0019] Referring to Figure 2, a trend index equation illustration according to
an example embodiment is shown. In an example embodiment, inputs to the trend
index equation include:
[0020] Heat Input [HI=l2Rt]
[0021] l=Current
[0022] R=resistance
[0023] t=time
[0024] The trend index equation is:
2
a1,2,3 * (lnew/lbase) * (rnew - rgun assy) Eq. 9
[0025] The coefficients a1,2,3 may be weighted based on the stack of metals to
be welded (thin/thin, thin/thick/thick; etc.) Referring to Figure 2, each area
120, 122,
124 calculated is in a Y2 cycle segment and modified based on current and a
(preset
variables). The results from each segment are then added together to generate
a
composite number. If the TI is blank, the system enters a learning routine. It
uses a
first base current to set the value for Ibase= It then uses a programmed
offset
resistance, timer for the offset resistance, or gun assy resistance for rgun
asst'. As
indicated, as the weld time increases, the resistance and current values
change.
The snapshots in Figure 2 126 illustrate the formation of a spot weld nugget
over the
robot cycle time and a type of a problem (spatter) that may occur during the
weld
operation.
[0026] Referring to Figures 3A and 3B, sample trend index plot or graph
screens according to an example embodiment are shown. In an example
embodiment for an automotive manufacturer, a user may specify the robots for
which
data are displayed by specifying a model identifier and weld identifier. The
user may
further specify a time period. The user may modify the selection criteria and
select
.
STL-SWM/CDA .6-
CA 02764092 2012-01-17
an "update" option. In Figure 3A, the graph comprises baseline data 132
representing target or desired trend index values over a specified period
time,
minimum 136 and maximum 130 trend index values, and finally, actual production
trend index values 134. As illustrated in Figure 3A, the. production data 134
may
vary from the target data 132 but fall within. specified tolerances (minimum
136,
maximum 130). The trend index shows variances in tolerance-conforming weld
operations.
[0027] In Figure 3B, the graph comprises baseline data 142 representing
target or desired trend index values over a specified period time, minimum 144
and
maximum 138 trend index values, and finally,. actual production trend index
values
140.. As illustrated in Figure 3B, a portion of the production data 146 may
exceed a
tolerance (e.g., minimum trend index value) indicating a problem with the
welding
operation at the indicated time. The problem may be attributable to the spot
weld
robot or another assembly process. For example, weld quality may be impacted
by
other assembly processes that impact sheet thickness, sheet flatness, sheet
alignment, air gaps between the sheets, etc. The ability to identify not only
anomalies in weld parameters but also the time at which they occurred may
assist
the manufacturer in determining whether other equipment, parts, or process
changes
are impacting the weld process.
[0028] Referring to Figure 4, a sample weld resistance data screen according
to an example embodiment is shown. Review of detailed weld data for a
particular
robot at a particular time, may assist the manufacturer in identifying
specific problems
related to the welding equipment or in other assembly processes. As indicated
in
Figure 4, production weld resistance data 152 may be compared against target
154
data or adjusted data 150 to determine whether an anomaly in the trend index
was
STL-SWMICDA -7-
CA 02764092 2012-01-17
attributable to the resistance data. Other data such as spatter and status
data 156
may be reviewed and analyzed to identify other factors that may have caused
the
trend index to exceed the tolerance.
[0029] Referring to Figure 5, a sample trend index analysis screen according
to an example embodiment is shown. In the example of Figure 5, trend index
data
162 over a specified period of several days is shown 160 is shown. As
indicated in
the approximately five hour portion of the data shown in Figure 5, the trend
index
values are fairly consistent for the first two hours of the period. During the
next three
hours, the trend index values experience a substantial increase and the
consistency
between the values decreases. The trend index, therefore, may assist the
manufacturer in identifying changes to assembly process that impact spot
welding
operation.
[0030] It is common. in automotive manufacturing to change weld points (e.g.,
a weld point by robot .A is moved to robot B) to enhance cycle time and/or
structure.
Such changes, however, may impact weld quality. The data in Figure 5, for
example, may indicate the need for a reordering of weld points (i.e., a change
to the
assembly process). Analysis of weld trend data assists the manufacturer in
determining whether certain process or equipment changes have a negative
impact
on weld quality. In the example shown, new welds had been added to the work
piece prior to its arrival at the specified spot weld robot. The additional
welds may
have altered the work piece (e.g., by introducing an air gap) in a manner that
impacted the resistance/current subsequent welds.
[0031] The weld trend index may be used to identify and correct various types
of problems. For example, if a problem of excessive expulsion is noted, the
trend
data may be used to modify the weld operation to decrease expulsion. Referring
to
STL-SWMICDA $ _
CA 02764092 2012-01-17
Figure 6A, the graph illustrates the trending of a weld point with excessive
expulsion. As the graph indicates, the trend value varies substantially from
point to
point. (Extreme drops may be attributable to rewelding and maintenance.) The
weld
parameters may be modified to reduce expulsion as indicated in the results of
{ Figure 6B. Variability, which indicates the severity of the spatter, is
reduced
following modification of the weld parameters. By tracking small variations in
parameters, the manufacturer may rely on fewer associates with greater skill
to track
and control welds and to oversee. adjustments over longer time frames required
for
low deviation management techniques.
[0032] "Cold welds" are another problem that may be corrected using trend
index data. Cold welds involve two or three sheet plate combinations in which
one
or more of the interfaces have no significant weld. Trend index data may be
analyzed to isolate cold welds and determine if other welds were stable before
and
after the cold weld. A spike in the trend index data, similar to a spike that
may be
present in an excessive expulsion, assists an associate in diagnosing possible
causes. Referring to Figures 7A and 7B, a tip dress and secondary circuit
analysis
may assist the manufacturer in understanding the source of a welding problem.
The
CFactor data in Figure 7A and the resistance data in Figure 713 appear normal.
Referring to Figure 7C, a current/resistance v. time graph for a failing weld
assists
an associate in locating a possible problem source. Resistance data for two
welds
prior to the cold weld (Figures 7D and 7E) and two welds after the cold weld
(Figures 7F and 7G) further the investigation of the failure. Figures 7H and.
71 .
comprise data for the beginning of the welds.. The weld shown in Figure 7H has
a
distinct discontinuity that is likely to have caused the problem (in relation
to the weld
shown for Figure 71). Because the weld points before and after on the same
body
STL-SWM/CDA -9-
CA 02764092 2012-01-17
as well as the same weld points before or after on the other bodies were good,
the
discontinuity relates to the likely culprit. A welding engineer and a
maintenance
associate may examine the defect body and the equipment to try to determine
the
root cause.
[0033] Referring to Figures BA and 8B, sample screens for a secondary
circuit analysis are shown. Collection and analysis of trend index data
supports
secondary circuit analysis by allowing a welding engineer or maintenance
associate
to analyze trend data related to tip dress checks. During production, welds
may
conform to pre-set tolerances but still degrade over time. Data collected
during
production may be compared in relation to baseline data to detect tip dress
problems. For example, degradation in CFactor data between a baseline 170 and
test 172 as shown in Figure 8A may indicate a failing tip dress. Resistance
data
variations between a baseline and production run may also indicate a failing
tip
dress. The trend index shows the rate of change as measured in tip resistance
and
therefore, may be used to detect anomalies.
[0034] Referring to Figures 9A-9B, 10A-10B, 11A-11 B, and 12A-12B, sample
graphs for analyzing tolerances based on weld types is shown. Trend index data
for
each type of weld may be analyzed to determine appropriate minimum and
maximum tolerances. Tolerances for different weld types may be established in
the
computerized system such that warnings or alerts are issued when trend index
values exceed an established tolerance. Figures 9A-9B depict data for a thin-
thin
weld. Figures 10A-10B depict data for a thick-thick weld. Figures 11A-11 D
depict
data for a thick-thick-thick weld. Figures 12A-12D depict data for a thick-
thick-thin
weld_
STL-SWM/CDA _10-
CA 02764092 2012-01-17
[0035] A computerized spot weld data management and monitoring system
and method is described in reference to the appended figures. The description
with
reference to figures is made to exemplify the disclosed computerized spot weld
data
management and monitoring system and method and is not intended to limit the
{ system and method or the features and functionality to the representations
in the
figures. From the foregoing description, it can be understood that there are
various
ways to construct a spot weld data management and monitoring system and method
while still falling within the scope of the present invention. As such, while
certain,
embodiments of the present invention are described in detail above, the scope
of the
invention is not to be considered limited by such disclosure, and
modifications are
possible without departing from the spirit of the invention as evidenced by
the
following claims:
STL-swM/CDA -11 _