Note: Descriptions are shown in the official language in which they were submitted.
WO 2021/250485
PCT/1B2021/054244
Systems and Methods for Detecting Magnetic Markers for Surgical Guidance
Field of the Invention
This invention relates in general to the field of surgical guidance, more
specifically to
systems and methods for detecting markers and tracers that aid in locating a
site in the
body, for example, a lesion for surgical excision.
Background of the Invention
Markers are used to guide surgeons to a region of interest during a surgical
procedure,
where the site of interest is not physically visible or palpable, for example
a small tumour
that needs to be excised. The marker may be placed during a biopsy or other
surgical
procedure at a site of interest in the body, for example a cancer lesion.
Ideally, such a
marker will be deployable through a narrow gauge needle. The marker is placed
under
imaging guidance such as ultrasound or X-ray/mammography. During subsequent
surgery,
the marker is detected and localised using a handheld probe which provides
audible, visual
or other feedback to the surgeon to guide the surgery. Typically the marker is
excised along
with the surrounding tissue.
A marker can also be used to mark a lymph node before a course of neo-adjuvant
therapy.
In this way a node can be readily identified after the neo-adjuvant therapy
for excision, even
if fibrosis from the therapy has affected the lymphatics so that conventional
lymphatic tracers
are not able to flow to the draining lymph nodes.
One such tumour-marking approach is to use a marker containing a radioisotope
such as
Iodine 90 which can be detected using a handheld gamma detection probe, e.g.,
a geiger
counter. However, use of radioactive materials is closely regulated, making it
challenging to
set up a radioactive seed programme in all but the largest academic hospital
centers.
A further approach is discussed in the Applicant's earlier published patent
applications (for
example, WO 2011/067576, WO 2014/013235 and WO 2014/140567) and uses magnetic
fields and a magnetic marker with high magnetic susceptibility. A handheld
probe generates
an alternating field which excites a magnetically responsive marker, and
detects the
responding magnetic field.
Markers that are liquid or liquid-borne may also be used in a surgical
procedure, for example
in the detection of sentinel lymph nodes for a biopsy. Such markers may be
referred to as
"tracers". Sentinel lymph node biopsy is an important technique used to stage
some
cancers, that is to evaluate the spread of certain cancer types, particularly
breast cancer. A
tracer can be injected near a cancer tumour. The tracer particles are then
taken up in the
lymphatic system and flow to the draining lymph nodes where they accumulate.
The nodes
may then located either by visual discoloration of the node or using a
handheld probe so that
they can be excised for pathological assessment. The nodes identified in this
way are called
'sentinel 'nodes because they are the ones to which the cancer may spread. The
surgical
procedure to identify and remove them is known as a sentinel lymph node biopsy
procedure.
1
CA 03181146 2022- 12-1
WO 2021/250485
PCT/1B2021/054244
Typically, the two procedures, excision of the tumour and excision of the
lymph nodes
happen in the same operation. Thus the tracer and marker can both be present
in the breast
at the same time.
As above, one approach is to use a liquid marker containing a radioisotope,
e.g., a
technetium-99m sulfur colloid. The radio-labelled colloid particles accumulate
in the draining
lymph nodes which can then be identified for excision using a handheld gamma
probe
(Geiger counter). However, technetium-99m has only a 6 hour half-life and so
must be
injected close to the time of surgery, thus creating a scheduling challenge.
It may also have
a complicated supply chain, and may not be available to isolated hospitals.
There may also
be interruptions in supply if a reactor producing the isotope is out of
operation at a given
time.
A further approach is to use a suspension of super-paramagnetic iron oxide
nanoparticles.
These particles have no half-life which means that they can be available in
any hospital and
can be injected a number of days before surgery, making scheduling more
convenient.
The nanoparticles can be detected by a magnetic probe such as the handheld
probe above.
However, such a probe may then respond to both a magnetic marker and an iron
oxide
nanoparticle suspension. In particular, a portion of the nanoparticle
suspension may remain
in the region of an injection site near the lesion. It is desirable to carry
out a lesion removal
procedure and a sentinel lymph node biopsy in a single surgery, however, it
has proved
problematic to provide a detection system that is able to distinguish the
lesion marker from
other magnetically responsive materials. This is illustrated in Fig. 1A.
Other magnetically responsive materials include surgical tools made from
metal. It is
desirable to develop magnetic markers or tracers that can be detected in the
presence of
metallic tools. This is illustrated in Fig. 1B.
The human body itself has a magnetic response that can interfere with the
detection of a
magnetic marker because the water that is the main constituent of human tissue
can give a
diamagnetic response. Typically, a large amount of human tissue is surrounding
the injected
marker during a localization procedure. A marker that can be accurately
localized against
the backdrop signal from the human body is therefore advantageous. This is
illustrated in
Fig. 10.
Multiple markers may be present at the lesion site. For example, a biopsy
marker may have
previously been placed to monitor the evolution of the tumoral mass over time
by means of
mammography or ultrasound scans. It is desirable that a probe adapted for
lesion
localization during surgery is only sensitive to the marker placed for this
purpose. This is
illustrated in Fig. 1D.
If a magnetic marker is used to mark a particular lymph node and a magnetic
tracer is also
used to map and identify other sentinel lymph nodes, then there may be one of
more lymph
nodes in which there is a magnetic marker and a magnetic tracer. It is
advantageous to be
able to localize and identify which lymph nodes are marked and which only
contain the
tracer. It may also be advantageous to be able to quantify the amount of
tracer in the node
2
CA 03181146 2022- 12-1
WO 2021/250485
PCT/1B2021/054244
even in the presence of a marker. Thus, there is a need to discriminate
between a marker
and a tracer within a lymph node. This is illustrated in Fig. 1E.
One proposed solution to the above issues is to use a marker that responds non-
linearly to
the exciting magnetic field. It is possible to analyse the full harmonic
response to
discriminate the marker from the tracers, metallic tools, the body or other
markers that have
a different and typically more linear response at the same field intensities.
Materials with a large Barkhausen discontinuity in the magnetisation curve, or
'Large
Barkhausen Jump '(LBJ) materials, undergo a rapid reversal of their magnetic
polarization
when excited by an external magnetic field whose field strength opposing the
instantaneous
magnetic polarization of the wire exceeds a predetermined threshold value,
also known as a
switching field. Thus, the marker exhibits bistable behaviour, reversing
between two
magnetic polarisation states. Each reversal of magnetisation generates a
magnetic pulse
with harmonic components. The profile and number of harmonics is measured (out
to many
tens of harmonics) to identify the marker from other materials.
It has been shown (for example CA3031282A1) that some LBJ materials can
exhibit a
strong non-linear response even when the marker is shorter than the critical
length and/or is
excited below the switching field. Markers formed from such materials are
known as sub-
bistable markers. Other markers with a smaller level or different type of non-
linearity in their
magnetic response could also be considered for discrimination against more
linear
secondary signals. For example, the non-linearity could be the result of the
inclusion of a
non-linear electronic component in the marker, like a diode.
Ideally, an exciting magnetic field generated by the magnetic probe (the drive
field) should
only include one frequency component at the fundamental frequency. Strong
magnetic fields
are also desirable to achieve large detection distances. However, it is
challenging to produce
an alternating magnetic field around the probe with both a high field strength
and a pure
single-frequency sinusoidal waveform at the desired frequency. When an
amplifier is driven
with sufficient power to produce a strong field, typically some distortion or
impurity is
introduced in the sinusoidal waveform, which results in harmonics of the drive
frequency
being added.
Harmonic components in the drive field may cause a response from any linear
tracer or
markers at the same harmonic frequencies. This results in interference with
the harmonic
signal produced by the non-linear marker and can impede its detection and
characterization,
as shown in Fig. 2.
Low distortion operational amplifiers can provide a harmonic distortion of
about -120dB,
where harmonic distortion is a ratio of the rms value of the harmonic of
interest (2nd, 3rd, etc)
to the rms signal level. However, such low distortion is achieved only at
currents of tenths of
mA, which are generally too low. Such amplifiers also use resistive loads in
general, while
magnetic probes typically use inductive loads. Furthermore, the harmonic
distortion of
operational amplifiers is typically measured by looking at voltages rather
than current.
However, in this application the relevant Harmonic Distortion is that of the
magnetic field,
3
CA 03181146 2022- 12-1
WO 2021/250485
PCT/1B2021/054244
which is generated from a current rather than a voltage. It is therefore not
straightforward to
produce highly pure drive fields with off-the-shelf electronic components.
A typical optimized harmonic distortion for the drive field in a magnetic
probe such as that in
WO 2011/067576, WO 2014/013235 or WO 2014/140567 may be in the range of -70dB
to -
100dB at the frequencies of interest. This indicates harmonic components less
than 10000-
100000 times smaller than the drive signal, and is acceptable for most
applications that rely
on a linear detection or even for high end audio systems. However, in this
application such a
level of harmonic distortion in the drive, when reflected by a linear magnetic
material near to
the probe, may easily be as large as the signal from a non-linear marker at
some distance
from the probe. Thus, there is a need to provide a system that is able to
distinguish a non-
linear marker from other magnetically responsive materials even with a non-
pure drive field.
The present invention aims to address this need.
Summary of the Invention.
According to a first aspect of the present invention, there is provided a
method for detecting
a marker according to claim 1.
Optional features are as set out in the dependent claims.
Brief Description of the Drawings.
For a better understanding of the present invention and to show more clearly
how it may be
carried into effect, reference will now be made by way of example only, to the
accompanying
drawings, in which:
Figures 1A to lE are illustrations indicating usage scenarios for an
embodiment;
Figure 2 is a number of charts showing the effect of a harmonic component in
the driving
field;
Figure 3 is a schematic diagram of a magnetic detection system according to an
embodiment;
Figure 4 is a schematic diagram of a magnetic detection system according to an
embodiment;
Figure 5A is a chart showing a magnetisation curve for an exemplary marker;
Figure 5B is a chart showing a magnetic response in the time domain;
Figure 5C is a chart showing a magnetic response in the frequency domain;
Figure 6A is a chart showing a magnetisation curve for an exemplary tracer;
Figure 6B is a chart showing a magnetic response in the time domain;
Figure 6C is a chart showing a magnetic response in the frequency domain;
Figure 7 is a schematic diagram of a magnetic detection system according to an
embodiment; and
Figure 8 is a flowchart showing a method according to an embodiment.
Detailed Description of the Invention.
The present invention relates to a detection system and method for
characterizing a marker,
and more particularly a magnetic marker that can be implanted for marking a
target site in
the body, and to the detection and localisation of the implanted marker using
a handheld
probe.
4
CA 03181146 2022- 12-1
WO 2021/250485
PCT/1B2021/054244
The marker may be implanted in a site requiring marking in the body. This may,
for example,
be a tumour or other lesion or site of interest in soft tissue. Examples
include but are not
limited to benign lesions, cancerous lesions and lymph nodes. The marker may
be placed in
or near a lesion or multiple markers may be placed to mark the margins or
perimeter of a
surgical site, for example the margins of a tumour or soft tissue sarcoma.
Figure 2 of the accompanying drawings shows a schematic diagram of an
embodiment of a
detection system and marker according to the present invention. The detection
system 1
comprises a probe 10 connected to a base unit 4. The probe 10 has one or more
drive coils
that generate an alternating magnetic field to excite a magnetic marker 6. A
magnetic tracer
7 may also be present near the marker 6.
The marker 6 comprises at least one piece of magnetically responsive material
and may
have a non-linear magnetic susceptibility. A magnetisation of the material may
respond in a
non-linear fashion to an external magnetic field. The material may have a
large Barkhausen
discontinuity in its magnetisation curve, and may be known as a large
Barkhausen jump
material, a LBJ material, a bistable switching material or a material with
large non-linearities
in its magnetisation curve. For example, when the LBJ material is exposed to
an external
magnetic field whose field strength opposing the instantaneous magnetic
polarization of said
length of material exceeds a predetermined threshold value, the switching
magnetic field
Hsw, its magnetic polarization undergoes a rapid reversal. This reversal of
magnetisation
generates a magnetic pulse with intense harmonic components.
The tracer 7 comprises a liquid comprising a plurality of magnetic
nanoparticles. For
example, the tracer 7 may comprise a plurality of iron oxide nanoparticles.
The nanoparticles
may be described as superparamagnetic nanoparticles. When the tracer 7 is
exposed to an
external field the magnetic response may be substantially linear, that is, the
magnetisation of
the tracer 7 is directly proportional to the applied field. The magnetic
response of the tracer 7
may be substantially linear when a strength of the external field is within a
certain range.
When the strength of the external magnetic field is higher than a certain
linear threshold, the
magnetisation of the tracer 7 may saturate, leading to a non-linear magnetic
response.
The probe 10 of the detection system further contains one or more sense coils
arranged to
detect the changes in the magnetic field caused by the change in magnetisation
of the
marker 6 and/or tracer 7.
To detect a marker 6 in a typical lesion or site of interest the probe 10 must
have a detection
depth of at least 30mm, preferably more than 40mm and more preferably more
than 50mm.
Ideally the marker 6 gives the same magnitude of response regardless of the
direction in
which the marker 6 is approached. This is to provide consistent feedback to a
surgeon on
the location of the marker 6 relative to the probe 10.
Figure 4 illustrates an example probe 10 in more detail. The detection probe
10 comprises a
drive coil 102 to generate a driving magnetic field and a sense coil to detect
a response
magnetic field.
The drive coil 102 is configured to generate the driving magnetic field by
means of an
applied electrical current, comprising a driving signal. The driving magnetic
field is an
CA 03181146 2022- 12-1
WO 2021/250485
PCT/1B2021/054244
alternating magnetic field generated to alternate with a fundamental frequency
component
The driving magnetic field may further comprise one or more additional
frequency
components fn. One or more of the additional frequency components fn may be
spurious or
unintended frequency components. Some or all of the additional frequency
components fn
may be harmonic frequencies of the fundamental frequency
The base unit 4 and probe 10 may further comprise a sine wave generator and
amplifier 100
and a harmonic filter and drive circuit 101, configured to generate the
driving signal at the
fundamental frequency f1. The sine wave generator and amplifier 100 is
configured to
generate and amplify an alternating current driving signal configured to
alternate at the
fundamental frequency fl. The driving signal may be generated with one or more
spurious
frequency components fn. Additional frequency components may be introduced by
amplification of the driving signal. The harmonic filter and drive circuit 101
is configured to
filter the driving signal and provide the driving signal to the drive coil
102. The harmonic filter
is configured to reduce the one or more additional frequency components fn in
the driving
signal. The harmonic filter may be a notch filter tuned to a specific
harmonic. The filtered
driving signal is provided to the drive coil 102 to generate the driving
field.
The base unit may further comprise one or more processing units, for example,
a
microcontroller and/or a Field Programmable Gate Array (FPGA). The base unit
may further
comprise a memory unit, an analogue to digital converter (ADC), and a digital
to analogue
converter (DAC). The memory unit may be, for example, formed of SD RAM or any
suitable
volatile or nonvolatile storage. The microcontroller may further control and
interact with a
computer memory. The microcontroller may be, for example, a STM32F769
microcontroller
from STM Electronics, or any other suitable microcontroller. The
microcontroller and FPGA
may generate the sine wave drive signal which is then converted to an analogue
signal by
the DAC before being amplified, for example using an operational amplifier.
The sense coil 104 is configured to generate an electrical sensed signal in
response to a
varying external magnetic field. The sense coil 104 is arranged to detect a
response
magnetic field generated by a magnetic material in response to the driving
magnetic field. In
particular, the sense coil 104 is arranged to detect a response magnetic field
generated by
the marker 6 and/or the tracer 7.
The detection probe 10 further comprises an electronic filter, e.g. a notch
filter, 106 and a
circuit to detect and amplify harmonic content 108. The electronic filter 106
may be
configured to reduce or remove the fundamental frequency fi from the sensed
signal, to
improve the sensing of other frequency components fn. The circuit to detect
and amplify
harmonic content 108 may further amplify one or more of the additional
frequency
components fn, e.g., corresponding to one or more harmonic frequencies of the
fundamental
frequency fl. The circuit may also suppress some unwanted frequency
components. The
operation of the components for processing the sensed signal will be described
in more
detail below.
Figure 5A shows a possible magnetisation curve for the magnetic marker 6. The
curve
shows the level of magnetisation of the marker 6 in relation to the strength
of an applied
external magnetic field. The marker 6 may comprise at least one piece of a
large
Barkhausen jump material (LBJ). As described above, the LBJ material may
produce a non-
6
CA 03181146 2022- 12-1
WO 2021/250485
PCT/1B2021/054244
linear magnetisation curve. According to the magnetisation curve, an
excitation field, H,
lower than the switching field 25 will result in little or no change to the
magnetisation, B,
except the effect of moving from '24 'to '25', a small change in magnitude,
but no change in
polarity of B.The curve shows a reversal of magnetisation once the switching
field indicated
by '25 'is exceeded. The curve shows a hysteresis effect, with a further
reversal of
magnetisation once the switching field indicated by '30 'is exceeded. In this
way, the reversal
occurs regularly in time with the same time period as the driving frequency.
Figure 5B shows a typical sensed signal corresponding to the magnetisation
curve of Figure
5A. When the marker 6 is excited by an alternating field with a sufficiently
high amplitude,
pulses corresponding to the reversal of magnetisation are seen in the time
domain. The
pulses may be superimposed onto a sine wave, if a spurious drive magnetic
field coupled
into the sense coils is not being filtered out fully. As will be discussed in
more detail below, a
material having a linear magnetic response would produce a sinusoidal sensed
signal at the
same frequency as the driving magnetic field. In comparison, the non-linear
response of the
marker 6 produces many harmonic frequency components in the sensed signal,
which
combine in superposition to produce the resulting pulse signal.
Figure 50 illustrates the sensed signal corresponding to the magnetisation
curve of Figure
5A in the frequency domain. In response to the drive magnetic field
substantially at the
fundamental frequency (fi), the sensed signal comprises at least one
additional frequency
component at a higher harmonic frequency. As shown, the sensed signal may
comprise a
significant component in each of at least the 2nd to 10th harmonic frequencies
(f2-fio) with
respect to the fundamental frequency. Higher frequency components may also be
present.
The marker 6 may be configured to provide a significant response at a specific
harmonic
frequency (fx). Such harmonic frequency fx may be utilised to distinguish
between a portion
of the sensed signal generated by the marker 6 and another portion generated
by one or
more secondary magnetic sources. The harmonic frequency fx may be utilised to
distinguish
between the marker 6 and the tracer 7. In some implementations, the third
harmonic
frequency (f3) may be utilised to distinguish between the marker 6 and the
tracer 7.
In the response magnetic field generated by the marker 6, a ratio between a
fundamental
frequency response and a particular harmonic frequency f, may be referred to
as a marker
response factor, or primary response factor. The marker response factor may be
approximately 100 or may be less than 100. In some implementations, the marker
response
factor may be less than 50, for example, the marked response factor may be
approximately
30 before any filter is applied.
Instead of operating in bistable mode, the non-linear marker may operate in a
sub-bistable
mode. As described above, some LBJ materials can still exhibit a non-linear
response at
fields smaller than the switching field (e.g. the third harmonic H3 response)
that is almost 2
orders of magnitude larger than non-LBJ materials. This can allow the
detection of a marker
which is further away from the probe 10, where drive fields are typically
small.
Figure 6A shows a typical magnetisation curve for the magnetic tracer 7. The
curve shows
the level of magnetisation of the tracer 7 in relation to the strength of an
applied external
7
CA 03181146 2022- 12-1
WO 2021/250485
PCT/1B2021/054244
magnetic field. The magnetic response of the tracer 7 is substantially linear
at low excitation
fields. In higher external magnetic fields the magnetisation of tracer 7 may
saturate, as the
nanoparticles in the tracer 7 fully align with the external magnetic field.
The magnetic
response of the tracer 7 is linear in a low excitation field, and may become
non-linear in
response to a higher excitation field. According to the magnetisation curve, a
sinusoidal
excitation field, H, having an amplitude lower than a certain linear threshold
will result in a
corresponding sinusoidal magnetisation, M. An excitation field having an
amplitude higher
than the linear threshold may produce distortions in the corresponding
magnetisation, i.e. a
non-linearity. In addition, if a central part of the magnetisation curve is
not linear (i.e. having
a constant gradient), then further non-linear distortions in the corresponding
magnetisation
may be produced.
Figure 6B shows a typical sensed signal corresponding to the magnetisation
curve of Figure
6A. When the tracer 7 is excited by an alternating field with an amplitude
lower than the
linear threshold, the sensed signal corresponds linearly to the excitation
field. Where the
alternating field has a sinusoidal form, the sensed signal has a corresponding
sinusoidal
form. When the tracer 7 is excited by an alternating field with a sufficiently
high amplitude,
pulses corresponding to the saturation of the tracer 7 magnetisation may be
seen in the time
domain. The non-linear response produces one or more harmonic frequency
components in
the sensed signal, which combine in superposition to produce the resulting
pulse signal.
Figure 6C illustrates the sensed signal corresponding to the magnetisation
curve of Figure
6A in the frequency domain. As can be seen, in response to the low-amplitude
drive
magnetic field substantially at the fundamental frequency (fi), the sensed
signal comprises
primarily the fundamental frequency (fi). In response to the high-amplitude
drive magnetic
field substantially at the fundamental frequency (f1), the sensed signal
comprises at least
one additional frequency component at a higher harmonic frequency. As shown,
the sensed
signal may comprise a significant component in any of at least the 2nd to 10th
harmonic
frequencies (f2-fio) with respect to the fundamental frequency. In particular,
there may be a
significant component in the odd harmonic frequencies and the third harmonic
in particular.
Higher frequency components may also be present.
Harmonic frequency components in the sensed signal generated by the tracer 7
can
interfere with the detection of harmonic frequency components generated by the
marker 6,
and can impede accurate detection of the marker 6.
As described above, the marker 6 may be configured to provide a significant
response in a
harmonic frequency fx. The harmonic frequency fx may be utilised to
distinguish between the
portion of the sensed signal generated by the marker 6 and the portion
generated by one or
more secondary magnetic sources. However, generation of a sensed signal
component at
the harmonic frequency fx by the tracer 7 may inhibit accurate detection of
the marker 6.
Generating a driving magnetic field with an amplitude below a linear threshold
for the tracer
7 can reduce the generation of harmonic frequency components by the tracer 7.
In
particular, using a low amplitude driving magnetic field can reduce the
generation of third
harmonic frequency components by the tracer 7.
8
CA 03181146 2022- 12-1
WO 2021/250485
PCT/IB2021/054244
In the response magnetic field generated by the tracer 7, a ratio between a
fundamental
frequency response and third harmonic frequency may be referred to as a
secondary
response factor.
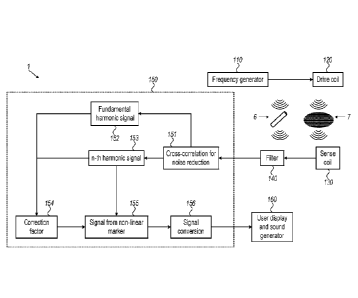
Figure 7 shows a block diagram of a magnetic detection system 1 according to
an
embodiment of the present invention. The magnetic detection system 1 comprises
a
frequency generator 110. An oscillator or a waveform generator is an example
of a
frequency generator 110. The frequency generator 110 is configured to generate
an
alternating signal. The signal may be sinusoidal. A frequency fD of the signal
may be in a
range of 100Hz to 100kHz. An example of frequency generator is a
microcontroller
outputting a sine wave that is then converted to an analog signal by a digital
to analog
converter and filtered by a low pass filter to smooth the signal
The generated signal excites one or more drive coils 120. The one or more
drive coils
generate an alternating magnetic field. The generated field extends into the
tissue containing
a magnetic marker 6 comprising at least one piece of a large Barkhausen jump
material
(LBJ). A sinusoidal signal can minimise the harmonic components in the
alternating
magnetic field, however, the alternating signal and/or the generated
alternating magnetic
field may comprise one or more spurious higher frequency components. The
alternating
magnetic field may comprise one or more harmonic components. A ratio between a
fundamental frequency and the harmonic frequency fx in the generated
alternating magnetic
field may be referred to as a driving factor.
The drive signal generated by the frequency generator 110 may be
electronically filtered to
attenuate any harmonic parts of the drive signal so that the alternating
magnetic field is
primarily at the desired excitation or drive frequency. This helps to avoid
spurious responses
at higher frequencies that could be erroneously interpreted as harmonic
responses. Filtering
and processing of the drive signal may significantly reduce the harmonic
frequency f.
component by several orders of magnitude. The harmonic frequency fx may be a
factor of
103 or 104 smaller than the fundamental frequency component. That is, the
value of the
driving factor may be in the range of 103 to 104, or higher. However, even
such a small
component at the harmonic frequency fx may impede the accurate detection of
the marker 6.
The alternating magnetic field excites the marker 6 and the magnetisation of
the marker 6
leads to the generation of harmonic components in the response field.
Depending on the
arrangement of the marker 6, the harmonics may be odd harmonics, (3rd, 5th,
7th etc.) or
even harmonics (2nd, 4th, 6th etc.) or a combination of both odd and even
harmonics. The
marker 6 can be detected by measuring the magnitude of one or more of the
harmonic
frequencies directly or by measuring the ratio of the magnitude of one or more
harmonics to
others or to the magnitude of the fundamental frequency.
The alternating magnetic field can also excite the tracer 7. The tracer
distribution in space is
normally unknown. However, if the amplitude of the alternating magnetic field
is below the
linear threshold for any of the tracer 7 in the volume surrounding the probe
10 then a
magnetic response of the tracer 7 is linear, independent of the distribution
of the tracer in
space. The magnetisation of the tracer leads to the generation of a response
field with a
large fundamental frequency component, in response to the large fundamental
frequency
component of the driving magnetic field. In addition, the linear response of
the tracer 7 may
9
CA 03181146 2022- 12-1
WO 2021/250485
PCT/1B2021/054244
lead to one or more higher frequency components in response to the spurious
higher
frequency components in the driving magnetic field. Thus, the response field
generated by
the tracer 7 may include one or more harmonic frequency components, due to the
harmonic
frequency components in the driving magnetic field.
The response field from the marker 6 and the tracer 7 is detected by one or
more sense
coils 130 to generate a sense voltage or current. The sense coils 130 may be
arranged in a
handheld or robotic probe, such as the probe 10. An electronic filter 140 may
be arranged to
filter out or attenuate at least components of the sense signal at the drive
frequency so that
the resulting signal has minimal content at the drive frequency and comprises
higher
harmonic components of the signal, for example the second, third, fourth,
fifth or seventh
order harmonics or combinations of these. The filter 140 may take the form of
a passive LCR
type filter comprising a known arrangement of for example capacitors,
inductors and
resistors or an active filter comprising a known arrangement for example based
on one or
more op-amps.
The filtered signal may be fed to a harmonic detection circuit 150 which
improves the signal
to noise ratio of one or more harmonic components of the signal and converts
the signal to a
measure of distance from the probe 10 to the marker 6. The harmonic detection
circuit 150
may be configured to filter a spurious harmonic response generated by the
tracer 7. The
harmonic detection circuit 150 may perform a number of operational steps. The
functions of
the harmonic detection circuit 150 may be performed by a microcontroller and
FPGA, as
described above.
The harmonic detection circuit 150 may be configured to perform cross-
correlation for noise
reduction 151. The harmonic detection circuit 150 may be configured to
separate the signal
into a plurality of frequency components by cross-correlation 151. For
example, the cross
correlation 151 may separate the signal into a fundamental harmonic signal 152
and at least
one n-th harmonic signal 153.
The harmonic detection circuit 150 may determine a correction factor 154. The
correction
factor 154 may correspond to a sensed signal that is generated by the tracer
7. The
correction factor 154 may correspond to a chosen n-th harmonic frequency
component
generated by the tracer 7. By removing the correction factor 154 from the n-th
harmonic
signal 153, the harmonic detection circuit 150 can isolate a signal from the
non-linear marker
155. In particular, the harmonic detection circuit 150 can isolate the n-th
frequency signal
generated by the marker 6.
The correction factor 154 may be determined based on the fundamental harmonic
signal
152. The correction factor 154 may be further based on the driving factor,
representing the
ratio of the fundamental frequency and the n-th harmonic frequency component
in the
driving magnetic field. In some implementations, the correction factor 154 may
be further
based on the characteristic spectral response of the linear tracer and the non-
linear marker.
The harmonic detection circuit 150 may reduce the fundamental harmonic signal
152 by the
driving factor to determine the correction factor 154. This is a practical
approximation that is
particularly valid as long as the tracer is about 10 times more linear than
the marker. This
linearity can be evaluated by means of the corresponding harmonic distortion.
CA 03181146 2022- 12-1
WO 2021/250485
PCT/1B2021/054244
The correction factor 154, corresponding to the n-th harmonic frequency
component
generated by the tracer 7, may be expressed in terms of the fundamental
frequency
component generated by the tracer 7, using the secondary response factor
described above.
Furthermore, the fundamental frequency component generated by the tracer 7 and
the
fundamental frequency component generated by the marker 6 together make up the
whole
fundamental harmonic signal 152. A part of the n-th harmonic frequency
component
generated by the tracer 7 can therefore be related to the fundamental harmonic
signal 152
based on the secondary response factor. A further part of the n-th harmonic
frequency
component generated by the tracer 7 can be related to the n-th harmonic
frequency
component generated by the marker 6, based on the secondary response factor
and the
marker response factor.
To the extent that the magnetic response of the tracer 7 is linear, the
secondary response
factor is substantially the same as the driving factor irrespective of the
spatial variation of the
drive field and of the spatial distribution of the tracer around the probe 10.
That is, the value
of the secondary response factor may be in the range of 103 to 104, or higher.
It can be
determined that the part of the n-th harmonic frequency component generated by
the tracer
7 that is based on the secondary response factor and marker response factor is
negligible,
due to the large disparity between the secondary response factor and the
marker response
factor.
As a result, the correction factor 154 may be determined to a high degree of
accuracy based
only on the fundamental harmonic signal 152 and the driving factor of the
driving signal.
The harmonic detection circuit 150 may be configured to remove the correction
factor 154
from the n-th harmonic signal 153 to isolate a signal from the non-linear
marker 155. The
signal from the non-linear marker 155 may be referred to as a detection
signal. A similar
methodology can be applied to reject spurious signals arising from different
sources, other
than the tracer 7. For example, a linear signal could come from metal objects
that are in the
proximity of the probe 10 during surgery, from the patient's body, from the
surgeon's hands
or from a biopsy marker. The harmonic detection circuit 150 may reject any
such signals that
are small enough that they don't saturate electronic components in the sense
circuits.
In some embodiments the frequency generator 110 may be configured to vary an
amplitude
of the driving signal over time. The amplitude of the alternating magnetic
field generated by
the drive coils 120 may be varied over time. In this way it is possible to
magnetically excite
different portions of volume around the probe 10 at different times. The
harmonic detection
circuit 150 may be configured to calculate a plurality of correction factors
154 at different
times, corresponding to different amplitudes of the driving signal. The
calculated plurality of
correction factors 154 may be arranged in an array of correction factors. The
signal from the
non-linear marker 155 may be isolated based on the array of correction
factors. In this way,
the system can more accurately reject spurious signals from a secondary source
that is
unevenly distributed around the probe 10.
The harmonic detection circuit 150 may be further configured to perform signal
conversion
156 on the n-th harmonic marker signal 155 to generate a measure of distance
from the
probe 10 to the marker 6. A user display and sound generator 160 provides a
visual and
11
CA 03181146 2022- 12-1
WO 2021/250485
PCT/1B2021/054244
audio output to the user indicating for example, the proximity of the marker 6
or the
magnitude of the magnetic signal. The system may indicate the proximity, size,
distance/direction or orientation of the marker 6, or combinations of these.
By generating a correction factor corresponding to the nth harmonic frequency
component
generated by the tracer 7, and isolating the n-th harmonic frequency component
generated
by the marker 6, the magnetic detection system 1 can provide a significantly
improved
indication of the proximity, size etc. of the marker 6. The magnetic detection
system 1 can
accurately distinguish between the marker 6 and tracer 7, even when the drive
signal does
not have a pure single-frequency sinusoidal waveform. The magnetic detection
system 1
may improve the accuracy of localising a marker 6, and allow for a more
accurate removal of
a corresponding lesion_ The magnetic detection system 1 may thus reduce the
occurrence of
excess tissue removal, by allowing a surgeon to more accurately determine the
extent of a
lesion, thus improving recovery time and a better surgical outcome.
In other cases, the magnetic detection system 1 may provide a more accurate
indication of
the size or quantity of a magnetic marker, where the magnetic marker may
correspond to a
sample of any material providing a non-linear magnetic response. The magnetic
detection
system 1 may improve the determination of size or quantity, even when the
drive signal
includes a spurious frequency component in addition to the desired fundamental
frequency
cornponent.
In addition, extracting the n-th harmonic frequency component generated by the
marker 6,
together with knowledge of its spectral response, is equivalent to extracting
the harmonic
frequency components generated by the tracer 7. This may be used to quantify
the amount
of tracer 7 in the proximity of the probe 10, or a distance of the tracer 7
from the probe 10,
even in the presence of a marker 6 that produces both an n-th harmonic
frequency and a
fundamental harmonic frequency component.
The markers of the detection system described above may each comprise one or
more
lengths of material ("magnetic marker material") which gives a harmonic or non-
linear
response to an alternating magnetic field produced by a large Barkhausen
discontinuity in
the magnetisation curve. Examples of such materials include iron-, cobalt- and
nickel-rich
glass-coated amorphous microwires, iron-silicon-boron based amorphous
microwires, iron-
cobalt based amorphous microwires, and bulk metallic glass wires.
In some embodiments, the length or lengths of magnetic marker material (formed
from a
material with a large Barkhausen discontinuity in its magnetisation curve) may
comprise a
length of solid wire (<10mm long) with a diameter <2mm so that the marker can
be delivered
through a small needle; a glass-coated microwire with core diameter between,
e.g., 5 and
100 micrometres and a coating thickness of between, e.g., 0.5 and 40
micrometres; a
bundle of 2 or more lengths of solid wire or glass-coated microwire; or a
hollow tube.
Any of the markers may comprise more than one piece of magnetic marker
material together
with additional material to join or enclose the pieces of magnetic marker
material and form
the final shape of the marker. The marker may comprise a tube, tubes or a
complete or
partial shell of another material within which the lengths of magnetic
material of the marker
12
CA 03181146 2022- 12-1
WO 2021/250485
PCT/1B2021/054244
are held. The marker may comprise electronic components e.g. coils, diodes and
transistors,
for example an LC circuit (a combination of a capacitor and an inductor) with
a diode can
produce a non-linear response. The magnetic material may also be coated or
enclosed
within a further biocompatible material. For example, the tube or shell
containing the
magnetic marker material comprises a biocompatible plastically deformable
material such as
a 316 stainless steel, Titanium, Nitinol, Titanium alloy or similar.
In some embodiments, the drive unit may comprise one or more drive coils.
Alternatively, an
alternating magnetic field may be generated by, for example, a spinning
permanent magnet.
The sensing unit may comprise one or more sense coils or, alternatively, a
solid state
magnetometer. In some implementations, the sense unit may comprise any
suitable
magnetic sensor, e.g., a Hall effect sensor, mems sensor, magneto-transistor /
magneto-
diode, a SQUID magnetometer, AMR sensor,or a GM R sensor.
The drive frequency may be in the range 100Hz to 100kHz. Higher frequencies
towards
100kHz may be advantageous to maximise the sensed signal. A higher frequency
may also
allow more cycles per second to be averaged during detection to improve noise
suppression
while still delivering a 'real time 'output to the user i.e. updating the
output signal at least 10
times per second. Hence for noise suppression a frequency of at least 1000Hz
and
preferably at least 10kHz may be desirable. For example, in order to give an
apparent 'real
time 'response to the user, the output may need to update at least every 0.1s.
A frequency
of 1kHz allows 100 cycles to be averaged between each update to the user, and
10kHz
allows 1000 cycles to be averaged between each update to the user.
Advantages may also be gained from a lower drive frequency, and these include
reduced
eddy current losses both in the marker (in cases where it is prone to eddy
currents for
example if it has high conductivity) and from the surrounding tissue and more
intense
magnetic switching in the marker. For reduced eddy current losses, a frequency
of less than
50kHz and preferably less than 30kHz may be advantageous. In the operating
room
environment, electromagnetic interference signals may be more frequently
experienced at
frequencies above 100kHz and therefore choosing a drive frequency such that
the
harmonics of interest are less than 100kHz may be beneficial.
Figure 8 of the accompanying drawings shows a flowchart representing a method
of
detecting a magnetic marker according to an embodiment. The method starts at
step S01.
At step S02, a driving magnetic field is generated. The driving magnetic field
is generated
with a driving unit. The driving magnetic field comprises a first driving
component (DH1) at a
first frequency and a second driving component (DH) at a second frequency. The
first
frequency may be a first fundamental frequency and the second frequency may be
an nth
harmonic of the first frequency.
At step S03, a response magnetic field is detected. The response magnetic
field is detected
with a magnetic field sensor. The response magnetic field comprises a first
response
component (SHi) at the first frequency and a second response component (SHn)
at the
second frequency.
13
CA 03181146 2022- 12-1
WO 2021/250485
PCT/1B2021/054244
SHi includes two sub-components: a marker sub-component (MHO and a secondary
sub-
component (TH1). SHn also includes two sub-components: a marker sub-component
(MHn)
and a secondary sub-component (TH,i).
The marker sub-components may be referred to as primary sub-components or
primary
portions. The secondary sub-components (or secondary portions) may come from a
magnetic tracer or other source of magnetic signal. M Hn is a desired signal
from the marker
and THn is an unwanted interfering signal from the tracer or other secondary
source.
At step SO4, a driving factor DF = DHi/DHn is generated. The driving factor
represents a ratio
of the first driving component and the second driving component in the driving
signal. The
driving factor is generated by a processor
At step S05, a correction factor to compensate for THn is determined. That is,
the correction
factor corresponds to the secondary subcomponent of SHn. The correction factor
is
determined by the processor. The correction factor is determined based on the
first
response component (SHi) and the driving factor (DF).
At step SOS, a detection signal corresponding to the marker sub-component of
the second
response component is determined. The detection signal is determined by the
processor.
The detection signal is determined based on the second response component
(SHn) and the
determined correction factor.
At step S07, an output signal is generated. The output signal is generated by
the processor
for output. The output signal is based on a strength of the detection signal.
The method finishes step S08.
Although aspects of the invention herein have been described with reference to
particular
embodiments, it is to be understood that these embodiments are merely
illustrative of the
principles and applications of the present invention. It is therefore to be
understood that
numerous modifications may be made to the illustrative embodiments and that
other
arrangements may be devised without departing from the scope of the invention
as defined
by the appended claims.
14
CA 03181146 2022- 12-1